
Another week, another Power BI post 🙂 This is the fifth post in my series focusing on Microsoft Exam 70-778, where I aim to provide a detailed overview and description of the skills needed to tackle the exam successfully. Last week’s post rounded off the opening theme, Consuming and Transforming Data By Using Power BI Desktop, as we focused on the options available to us to help tidy up data within the Power Query Editor. We now start to move outside of this area of the application with the Modelling and Visualising Data theme and, specifically, the following skill area:
Manage relationships; optimize models for reporting; manually type in data; use Power Query
As before, to follow on as part of any examples, make sure you have downloaded the WideWorldImporters sample database and hooked up Power BI Desktop to the tables described in my first post in this series.
Relationships
It will be a rare occurrence if you find yourself regularly working with a single table object within Power BI. The required data for most reporting situations will generally reside in different locations - whether within separate tables in a single SQL database or across different instances or applications. In most cases, there will be some field - or key - that will link records together and act as the bedrock when defining Power BI Relationships.
For those who are coming from a SQL or Dynamics 365 Customer Engagement background, I would expect that the concept of Relationships will present little difficulty in grasping. But, for those who are coming in cold, it is worth considering the following question - Why might you want to look at defining Relationships in the first place? The reasons will generally be specific to your business need, but can be generalised as follows:
- Database normalization creates a degree of complexity that can be difficult to unweave from a reporting standpoint. Customer records may exist in one table, Address details in another, their orders in a third…you get the picture. Consequently, there is a need to bring this all together into a single/simplified view when developing reporting solutions; Relationships help to meet this objective.
- The great benefit of using Power BI is its ability to provide a consistent, contextual filtering experience across Reports. So, for example, when adjusting the range on a Date slicer, all other visualisations are automatically refreshed to only show data from the updated period. This wizardry is all achieved by Relationships and the cross-filtering rules you define for them.
- Power BI data models can grow in complexity over time. The defining of Relationships simplifies this to a degree and allows you to view all of your queries in a clean, visual manner.
We can see an example of how a Power BI Relationship looks in the picture below:
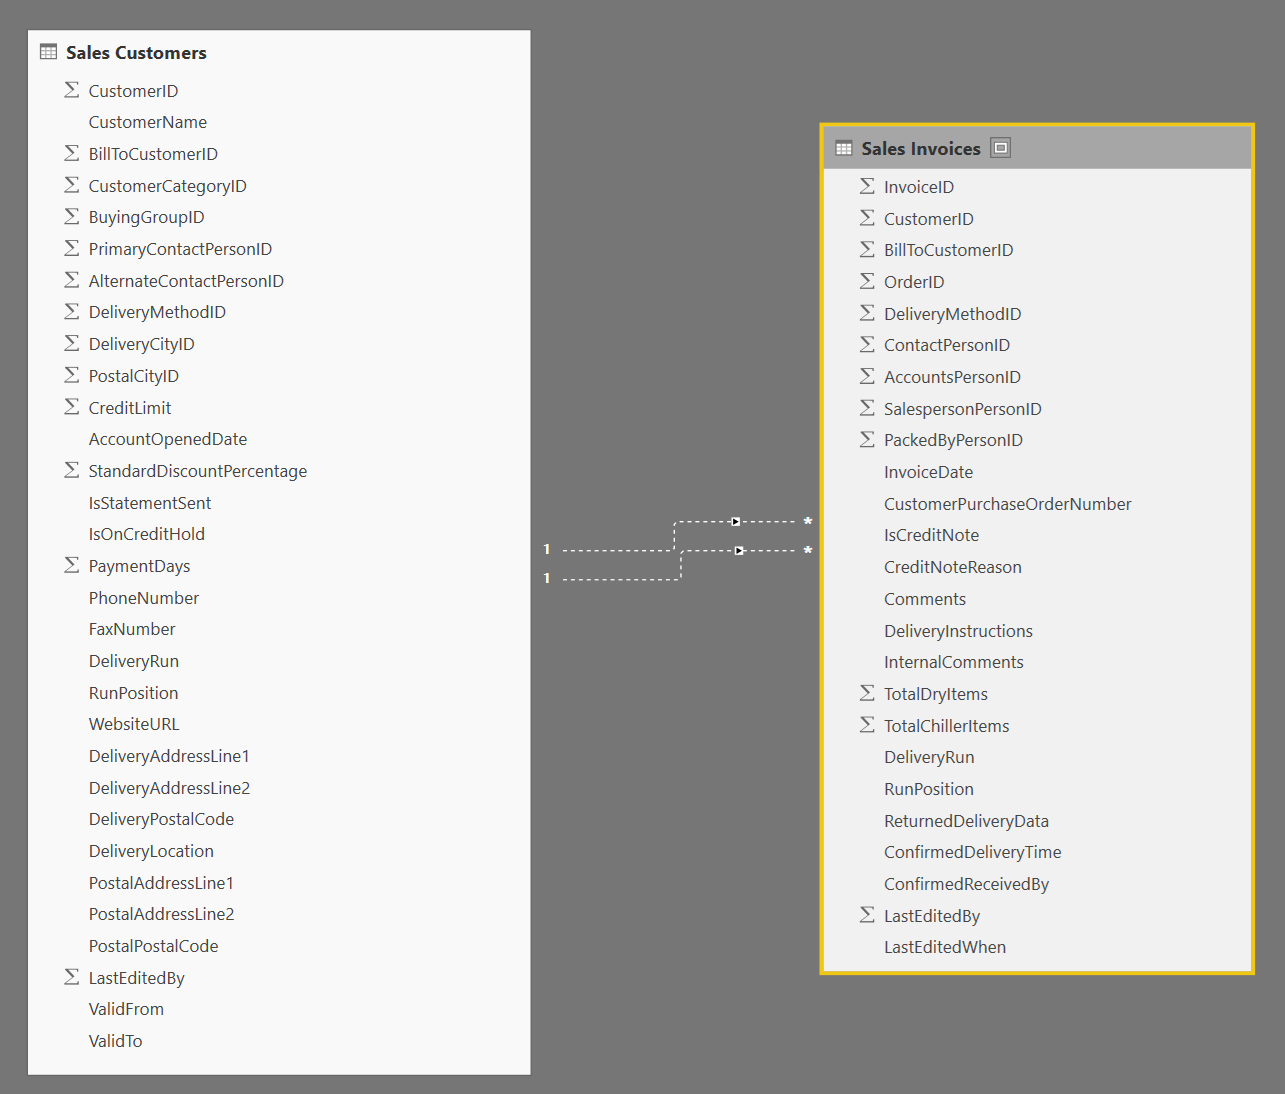
We can see above two one-to-many (1:N) Relationship between the Sales.Customers and Sales.Invoices tables from the WideWorldImporters database. The matching key, in this case, is the CustomerID field.
Relationships are created and managed in one of two ways:
- Automatically when bringing data into Power BI Desktop the first time. Power BI will automatically detect and build any Relationships within a SQL Server-derived data source, based on any PRIMARY KEY/FOREIGN KEY CONSTRAINTs that exist already. The Select Related Tables option can be used to intelligently determine which tables can be brought in on this basis.
- By going to the Manage Relationships button on the Home tab within the main Power BI window (NOT the Power Query Editor). This option will allow you to manage and create new Relationships based on your requirements. An Autodetect… option is also available, which behaves similarly to the data source auto-detection discussed previously. The example below shows the WideWorldImporters Relationships referenced earlier:

The walkthrough exercise at the end of this post will go through the process of creating a Relationship from start to finish, but it is useful at this stage to dive into the more detailed concepts involving Relationships:
- The following types of Relationships (or Cardinality) can be specified:
- One to Many (1:N) / Many to One (N:1)
- One to One (1:1)
- Many to Many (N:N) - This feature is currently in Preview and caution is advised when using it.
- Each Relationship requires that a Cross filter direction is specified, which will determine how filters cascade out to related tables. These are configurable as either Single (in the direction of your choosing - left to right or right to left) or Both. 1:N Relationships must always use Both.
- Only one Relationship is classifiable as Active between two tables at any given time. Despite this limitation, it is possible to define multiple Relationships, if required. It is essential to understand with this that only Active Relationships are utilisable when performing DAX column/measure calculation, which may lead to unintended results. You can get around this by either changing the Inactive Relationship to Active or by taking advantage the USERELATIONSHIP function to force DAX to pick your preferred Relationship.
- The Assume Referential integrity option is only available when you are using DirectQuery and, if enabled, underlying queries will attempt to use INNER JOINs as opposed to OUTER JOINs in any query folding. While this can speed things up, it may also lead to missing or incomplete results.
Formatting Columns
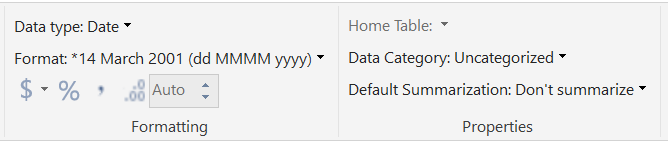
We saw in last week’s post some of the more functional data formatting options that the Power Query Editor provides. I say the word functional in the sense of meaning formatting that serves a specific, data quality need, as opposed to a styling requirement. Moving outside of the Power Query Editor and we can discover a whole host of additional styling formatting options on the Modelling tab:
Let’s break all this down into a bit more detail:
Formatting
- Data Type: Here, it is possible to override the data type for a particular column value. The options available are:
- Decimal Number
- Fixed decimal number
- Whole Number
- Date/Time
- Date
- Time
- Text
- True/False
- Binary
- Format: Depending on the Data Type value selected, the list of choices here will change accordingly. In most cases, such as for Text values, you will only have a single selection available, but your options for Date/Time and Currency values are considerably richer. For example:
- Date/Time values can be formatted in numerous different ways, both from a styling and locale perspective. This includes formatting dates in the good ol’ British way, meaning that the ISO 8601 date value 2018-01-01 can appear as 01-01-2018, 1 January 2018 or even Monday, 1 January 2018.
- Currency values are modifiable to any global currency sign or shortcode. So, the value 50 is displayable as both £50 and 50 GBP for British Pound currency figures.
- $ Button: This is, in effect, an alternate way of changing the Currency value on a field, as described previously.
- % Button: Converts a value to a percentage. For example, the Whole Number value of 75 would appear as 75%.
- ’ Button: Adds a thousand separator to a number value. Therefore, 100000 becomes 100,000.
- .0/.00 Button: Adjusts the number of decimal places at the end of a numeric, up to a maximum limit of 15.
Properties
- Data Category: This option, designed primarily for String values, allows you to indicate the type of data the field represents, with a specific focus towards mapping capabilities. For example, it is possible to mark a field as State or Province, to ensure that Power BI does not make an incorrect assumption when attempting to plot an address to a map. Some additional options here include:
- Latitude/Longitude to, again, ensure accurate plotting to a map visual.
- Classifying a field as containing either a Web URL or Image URL.
- Categorising a field as Barcode value.
- Default Summarization: When building out a report and adding fields to visualizations, Power BI assumes the preferred aggregation value to use. This will be pretty spot on in most cases - for example, Currency fields will default to a Sum aggregation. However, it is possible to override this option to use any of the following, easily guessable, alternatives:
- Don’t summarize.
- Sum
- Average
- Minimum
- Maximum
- Count
- Count (Distinct)
Sort By Column
There may be a requirement to perform sorting of column values, based on some predefined logic as opposed to merely alphabetical or numeric order. The best example to provide here would be for Month Names. Instead of sorting in alphabetical order, like so:
April
August
December
February
etc.
We would want to sort by logical Month order i.e.:
January
February
March
April
etc.
Another scenario could be column sorting based on High, Medium and Low categorisation; all records with a value of High would need to appear first and the Medium second, as opposed to Low if sorted alphabetically.
Sort By Column gives us the flexibility to achieve these requirements, but it is crucial first to ensure that a proper sorting column resides within your query. Going into the Power Query Editor and modifying the Sales CustomerTransactions table enables us to add on a Month Number column for the TransactionDate field by going to the Add Column tab and selecting Date -> Month -> Month option:
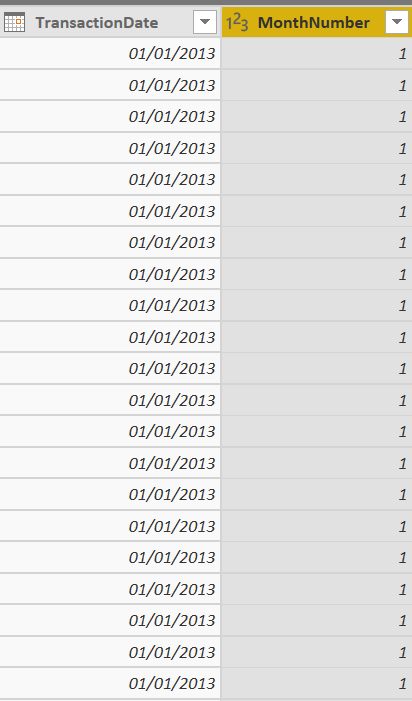
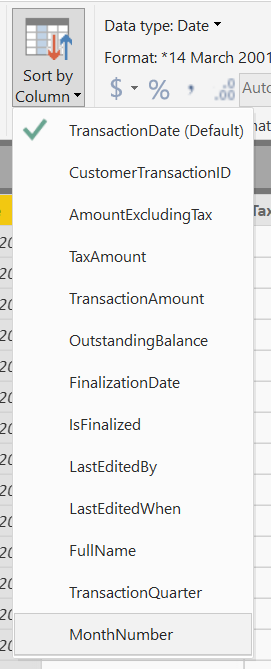
Coming out of the Power Query Editor using the Close & Apply option, go into the Sales CustomerTransactions table within the Data tab and select the Sort By Column option, selecting the MonthNumber field as the Sort by Column:
We should now see when adding a simple Table visualization to a report, that the Month values derived from TransactionDate appear in correct sort order:
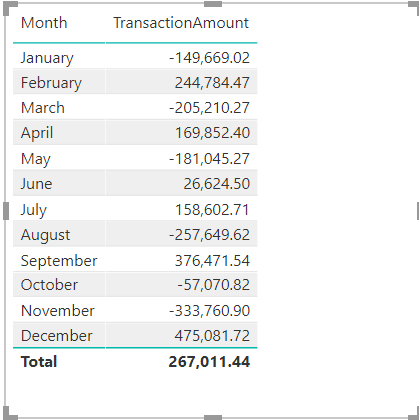
Through this example, you can hopefully see how straightforward it is to accommodate more unique sorting requirements with minimal effort.
Manual Data Entry
Although Power BI assumes, for the most part, no requirement to define any manual data as part of your reports, there may be situations where this need arises. For example, on the WideWorldImporters Sales.CustomerTransactions table that has been built out through this series, you may want to define a manual list of all FullName values that can then be linked up to a slicer for filtering purposes. There are two ways this requirement can be met, with both options having their benefits and potential preference, based on how much you like to code 🙂 :
- The Enter Data button on the Power Bi Desktop Home tab allows you to create a new Table object based on manual data entry. The table can have as many columns as you like and, what’s nifty is that it supports full copy + paste functionality from other applications. It is a VERY convenient feature to bear in mind:
- Using PowerQuery, it is also possible to define custom Tables populated with data. We saw an example of how to achieve this in last weeks post when creating some example data for cleansing, but there are some further options available to us:
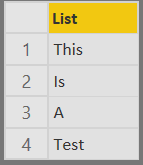
- Simple lists of data can appear within brackets. For example, the following M code:
let Source = { "This", "Is", "A", "Test"} in Source- Would generate the following data within Power Query:
- Records with multiple rows/fields can also be generated using the example code below:
Table.FromRecords({[Did = "This", You = "is", Know = "Testing"]})- Which would appear as follows:

- Finally, as shown last week, it is possible to create a Table object, using the example code below:
#table(
    {"Forename", "Surname", "Description"},
    {
        {"JANE","smith","   this describes the record"},
        {"alan", "JOHNSON", "    record description detected    "},
        {"   MARK", "CORRIGAN    ","another description"},
        {"JANE","smith","   this describes the record"}
    }
)
The tools available here help to satisfy many potential ad-hoc requirements when using Power BI Desktop and when used in conjunction with other features described in this post and earlier in the series, start to become pretty powerful.
Example: Creating Relationships
In this very straightforward example, we will see how it is possible to create a Relationship manually from within Power BI Desktop, using the WideWorldImporters sample database as our connection source:
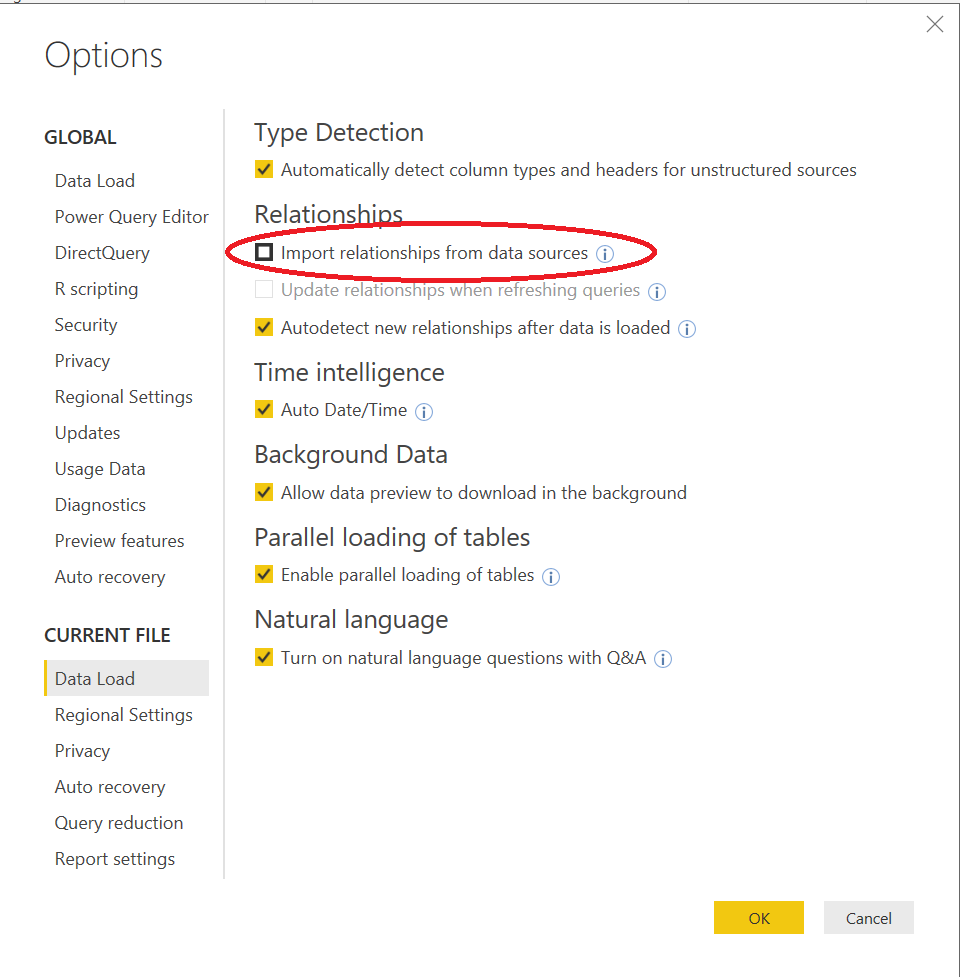
- It will be necessary to disable to automatic creation of Relationships when importing data for this exercise. This is done by going to the Options -> Data Load screen and ensuring that the appropriate option has been unticked:
- Follow the instructions discussed in this post to connect to the WideWorldImporters database but, on this occasion, ensure that the following tables only are selected for import:
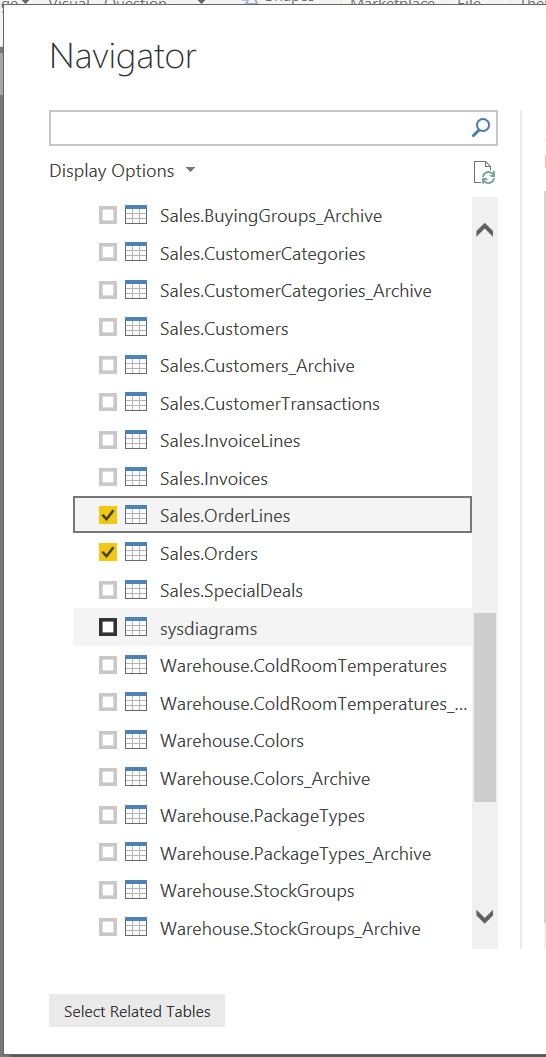
- Once the data loads into Power Bi, navigate to the Relationships tab and you should see the two table objects indicated below (you may need to resize them accordingly for all fields to display):
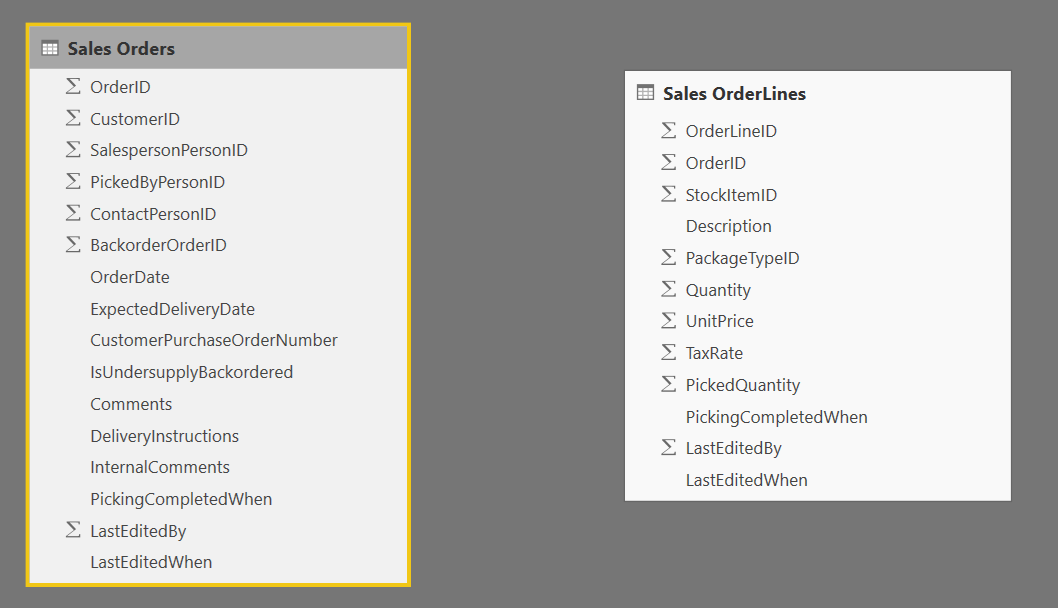
- Because of the setting change carried out in step 1, the underlying Relationship between both of these tables in SQL has not been detected and added. To fix this, click on the Manage Relationships button on the Home tab and then the New button to open the Create relationship window, as indicated below:
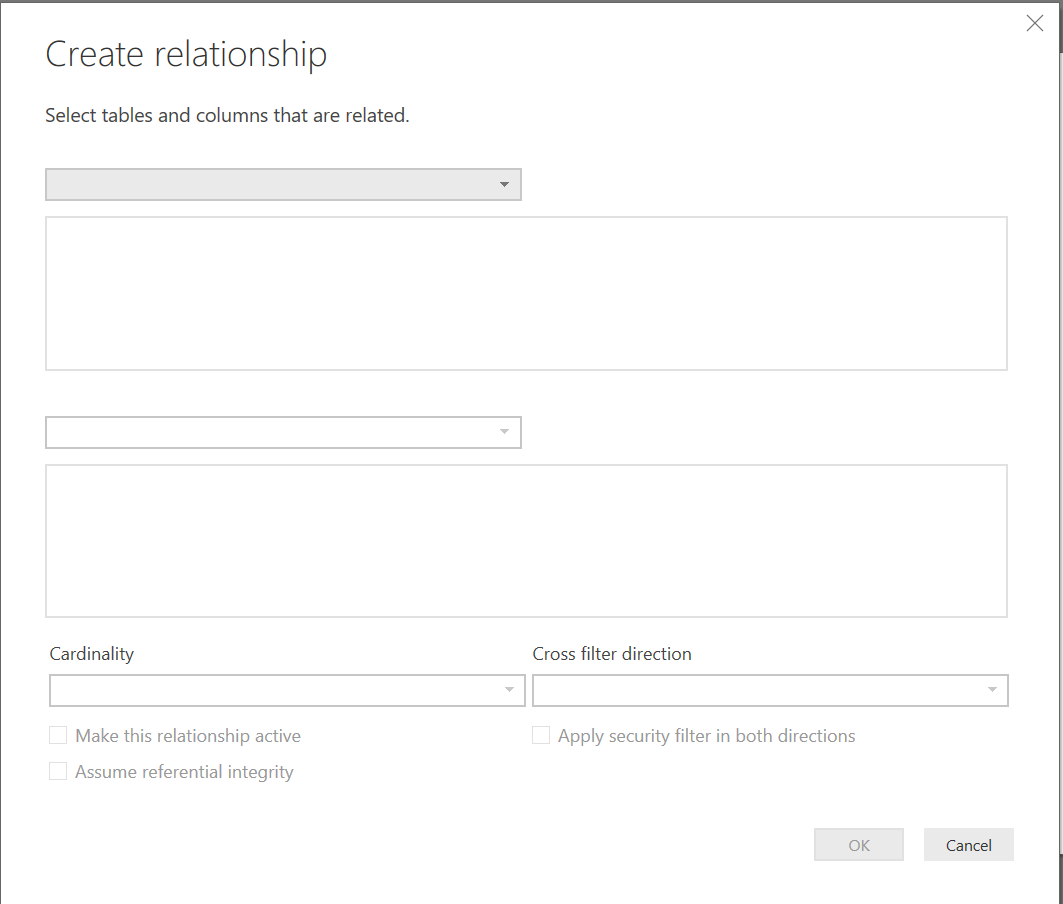
- Define the following settings for the new Relationship, as described and illustrated below:
- In the first drop-down box, select Sales Orders and verify that the OrderID column highlights itself.
- In the second drop-down box, select Sales OrderLines and verify that the OrderID column highlights itself.
- For Cardinality, ensure One to many (1:*) is selected.
- For Cross filter direction, ensure Both is selected.
- Ensure Make this relationship active is ticked.

- Press OK and then Done to create the Relationship. The Relationship window should refresh accordingly to indicate that a new Relationship exists between the two tables:

Key Takeaways
- Relationships form the cornerstone of ensuring the long-term viability and scalability of a large data model. Assuming you are working with well-built out, existing data sources, Power BI will automatically detect and create Relationships for you. In situations where more granular control is required, these Relationships can be specified manually if needed. It is worth keeping in mind the following important features of Relationships:
- They support one-to-one (1:N), one-to-many (1:N) and many-to-one (N:1) cardinality, with many-to-many (N:N) currently in preview.
- Filter directions can be specified either one way or bi-directionally.
- Only one relationship can be active on a table at any given time.
- It is possible to sort columns using more highly tailored custom logic via the Sort By Column feature. The most common requirement for this generally involves the sorting of Month Names in date order but can be extended to cover other scenarios if required. To implement, you should ensure that your data has a numbered column to indicate the preferred sort order.
- Moving outside of the Power Query Editor presents us with more flexibility when it comes to formatting data to suit particular styling or locale requirements. While the majority of this functionality provides date/time and currency formatting options, for the most part, it is also possible to categorise data based on Location, the type of URL it is or on whether or not it represents a Barcode value; these options can assist Power BI when rendering certain types of visualizations.
- There may be ad-hoc requirements to add manually defined data into Power BI - for example, a list of values that need linking to a Slicer control. The Enter Data button is the “no-code” route to achieving this and supports the ability to copy & paste data from external sources. For more advanced scenarios, you also have at your disposal a range of M code functionality to create Lists, Records and Tables, which can be extended further as required.
Hopefully, by now, you are starting to get a good feel for how Power BI works and also the expected focus areas for the exam. Next weeks post is going to be a biggie, as we jump head first into DAX formulas and how they can be used for calculated columns and Measures. We’ll also introduce the concept of What-if Parameters and how they work in practice.