
Welcome to the second post in my series concerning Microsoft Exam 70-778, where I hope to provide a detailed revision tool for those preparing to take this exam. Last week’s post introduced the fundamental notions behind connecting to data sources in Power BI Desktop, and we will lead on from this to look at the Perform transformations topic, which covers the following skills:
Design and implement basic and advanced transformations; apply business rules; change data format to support visualization
Let’s jump straight in by welcoming the concept that is most relevant to all of this…
Power Query
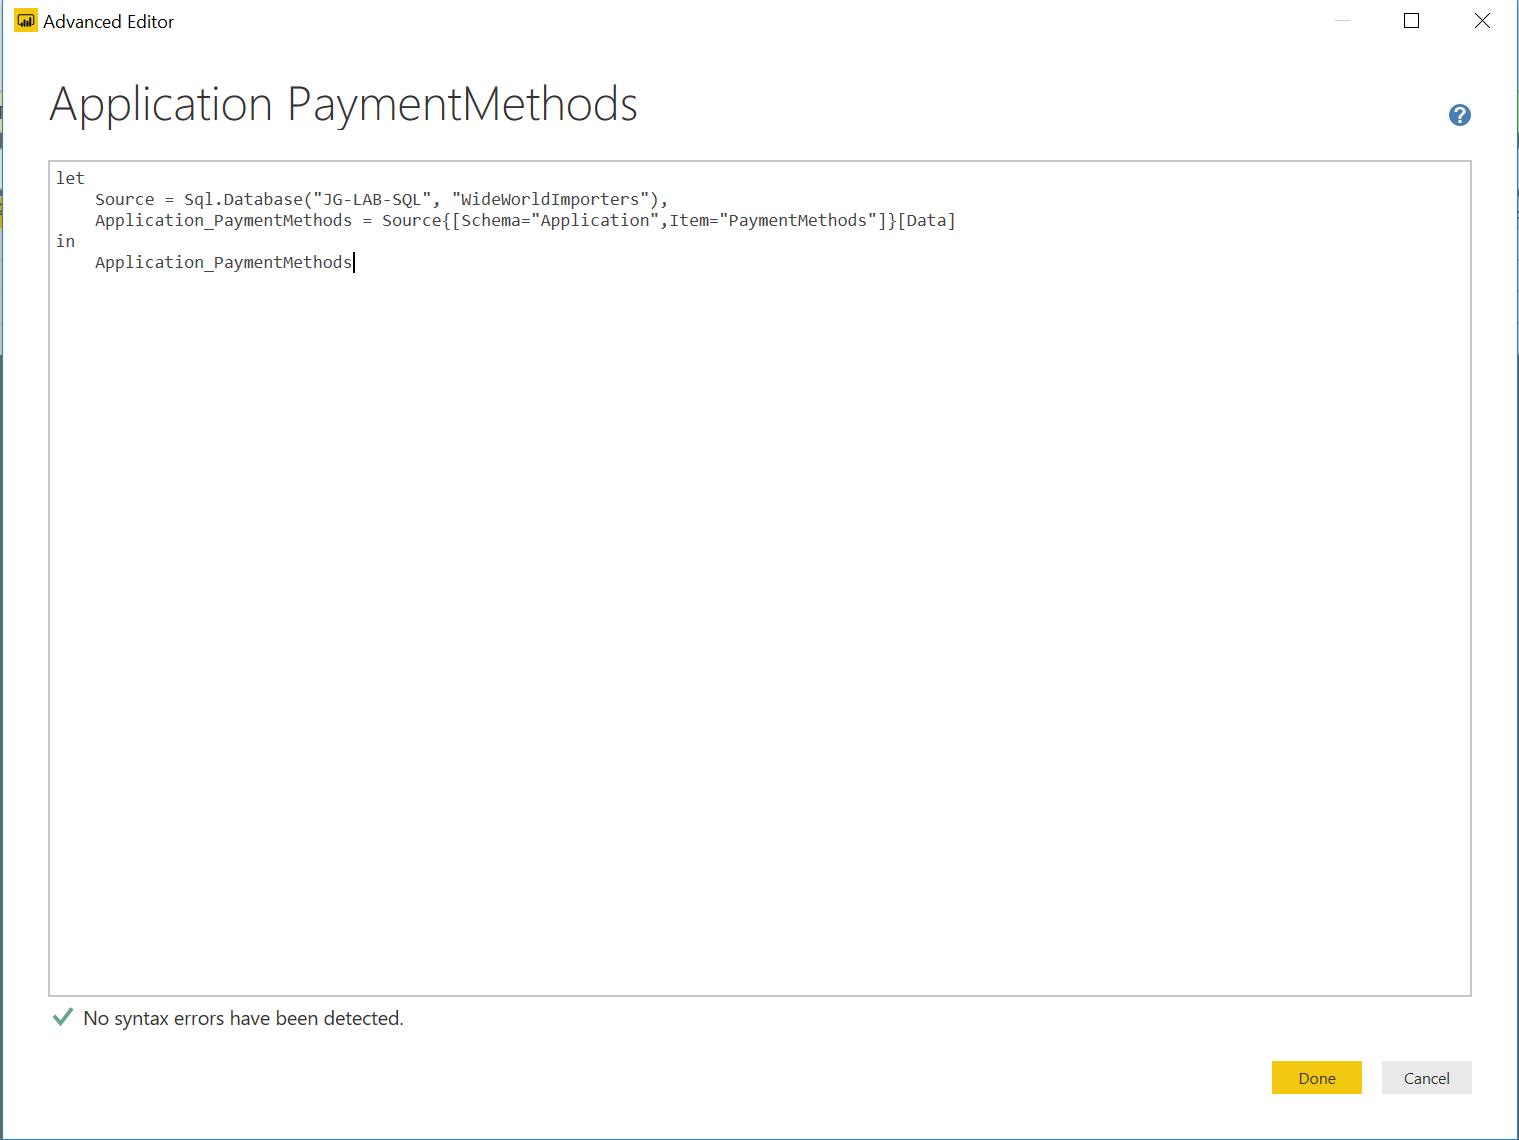
First introduced in Excel some years back, the Power Query M formula language is very much the engine underneath the hood of Power BI. It deals with everything from the retrieval of data through to the removal of rows, creation of new columns, filtering - basically, if it concerns data manipulation, Power Query can more than likely handle it. By right-clicking any Query within the Power Query Editor window and selecting Advanced Editor, you can view the syntax of the language in detail and edit it to your hearts contents. In the screenshot below, Power Query is connecting to the WideWorldImporters database and returning the table Application.PaymentMethods:
Now, if you are coming into Power BI for the first time, the thought of having to learn a whole new programming language can be a little daunting. That is why the Power Query Editor is the ideal tool for beginners to carry out most (if not all) data transformation from within the Power BI interface. We will take a look at this topic in more detail shortly, but when it comes to working with Queries, it is worth mentioning the following pieces of functionality that we have at our disposal:
- The Advanced Editor has some minimal syntax error detection built in, but nothing on the same par as IntelliSense. Triple checking your Queries is always recommended to avoid any errors when loading your data.
- Queries can be renamed at any time and be given detailed descriptions if required. This step is generally recommended to help users better understand the data they are interfacing with.
- Queries will remain actively loaded within the Power Query Editor, unless and until they are disabled explicitly by right-clicking on them and de-selecting the Enable load option. Queries with names in italics are disabled.
- It is possible to both Duplicate & Reference queries at any time. The Reference option is particularly useful if you need to create variants of a particular source query that filters on different values, for example. Regardless of whether the Query is loaded directly into the model or not, it can be duplicated or referenced without issue.
- It is possible also to create Parameter Queries, and even Custom Function Queries to, for example, perform highly specific transformation actions for each column value provided. Parameters will be discussed in greater detail later on, whereas Custom Functions are beyond the scope of the exam.
Transforming Data: A Brief Overview
The Transform and Add Column tabs within the Power Query Editor are your go-to destinations when it comes to finding out what you can do from a transformation perspective:
![]()
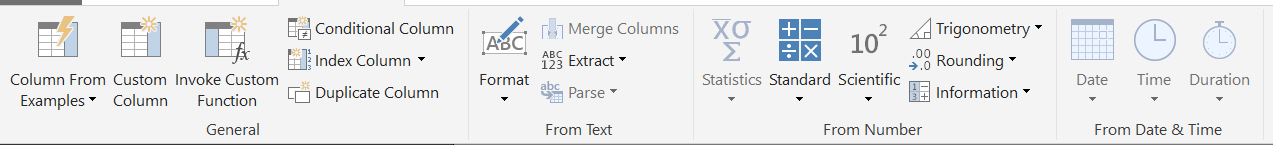
With the toolbox provided here, you can do things such as:
- Pivot/Unpivot your data.
- Replace column values.
- Split data based on delimiters.
- Perform advanced mathematical calculations.
- Create new columns derived from date/time values, such as Month Name or time durations.
- Define new columns based on examples, specific calculations/conditions or from another column value.
The example at the end of this post will cover some of these specific transformation steps in detail, showing you how to apply them straightforwardly in the Power Query Editor.
Merging & Appending Queries
In some cases, you are likely to be bringing in data that is similar or related in some way, and your principle requirement will be to bring this together into a more simplistic view. In this regard, the following two features are especially useful:
- Merging: This involves combining two queries horizontally. If you are familiar with SQL JOINs, then this is the same thing. You define your base table and table to merge, the key values to pair on and then, finally, your join type. You have the following options at your disposal here:
- Left Outer
- Right Outer
- Full Outer
- Inner
- Left Anti
- Right Anti
- Appending: Best used when you have queries with the same overall structure, this step involves combining Queries vertically. The number of Queries can be as many as you want and you have the option of either a) appending onto the existing Query or b) onto an entirely new one. It is also possible, but not recommended, to Append Queries with entirely different structures.
Using Parameters
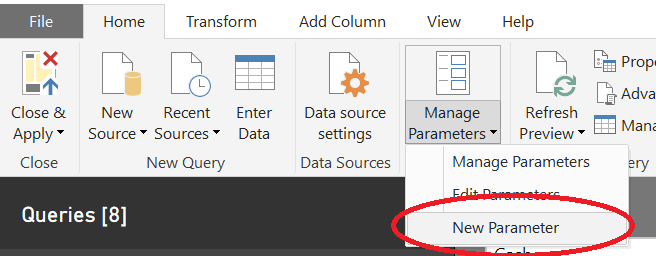
Parameters are a great way to give you the ability to quickly and easily modify filters in one or more Queries. They are created from the Home tab by going to the Manage Parameters -> New Parameter option, as indicated below:
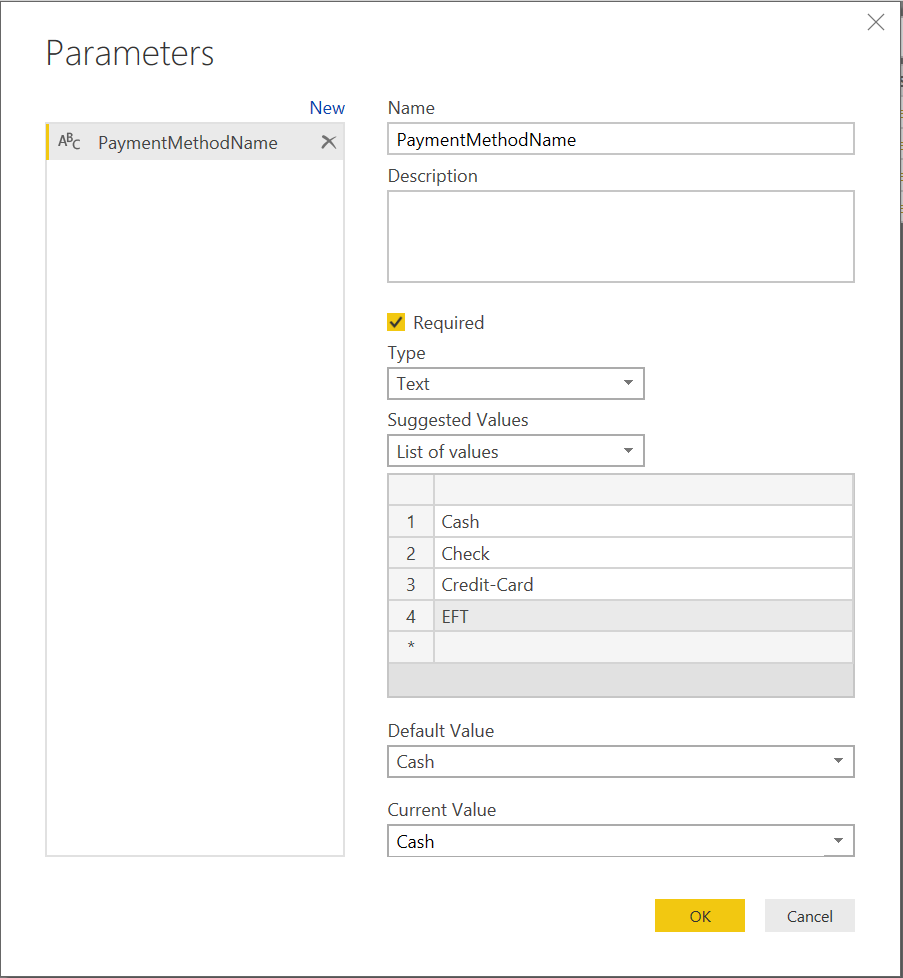
Then, you will be able to define your Parameter. For example, to create a Parameter that will filter the PaymentMethodName field on the Application PaymentMethods Query, specify the settings as indicated below:
A new Query for the Parameter will appear on the left-hand pane, like so:
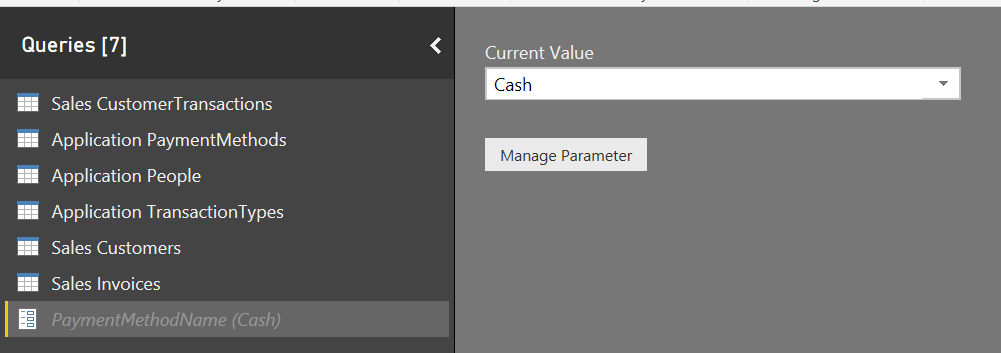
Then, go to the Application PaymentMethods, click on the button with the arrow and select Text Filters -> Equals… to open the Filter Rows window. Make sure that equals is selected and, on the second dropdown box, select Parameter and then the newly created Parameter:
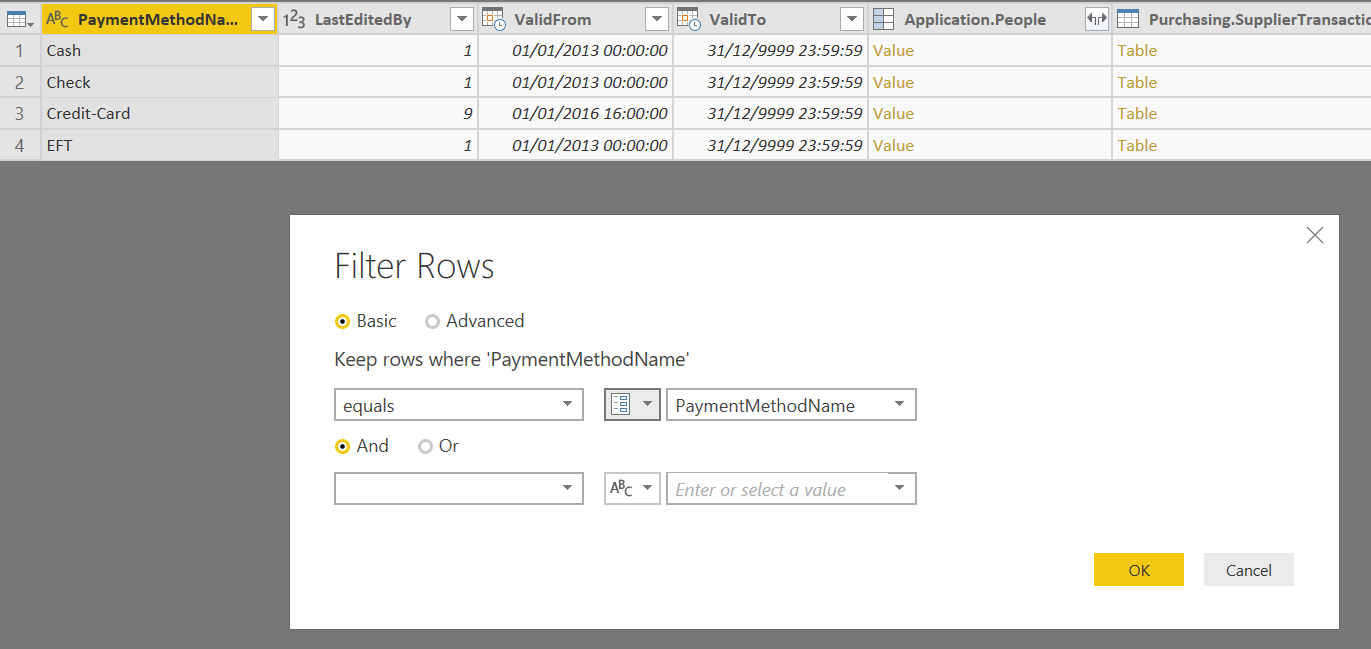
Pressing OK will then apply the appropriate filter. Any changes made to the selected Parameter value will update automatically to the filters you have defined. When it comes to working with many filters across multiple Queries, Parameters can take away a lot of the pressure involved.
Query Folding
Where possible, when performing transformation steps within the Power Query Editor, Power BI will attempt to figure out the most optimal natural language to use when querying the data source and apply this accordingly. In most cases, this will only occur for SQL based data sources. In the example below, after right-clicking on the Applied Steps for the Sales.Invoice query and selecting View Native Query, we can view the underlying T-SQL query used:
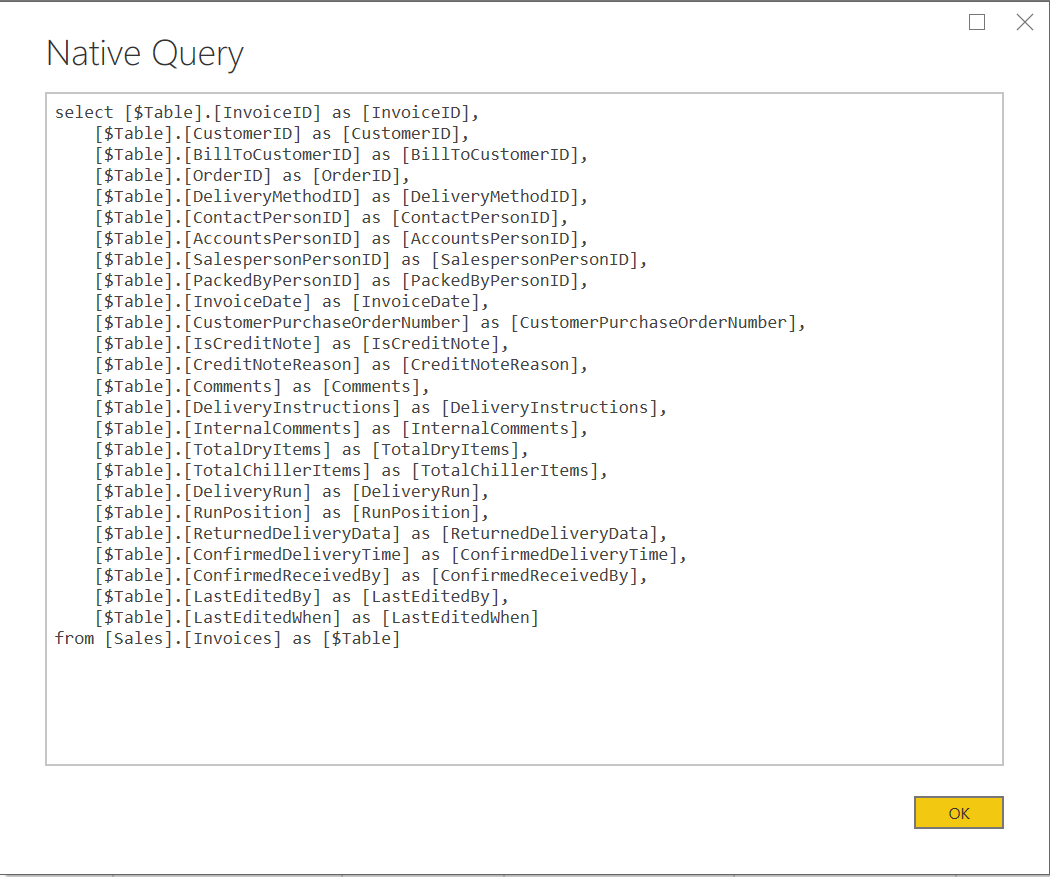
You should, therefore, pay careful attention to the order in which you apply your steps to ensure that Query Folding takes place wherever possible. There is an excellent article on the MSSQLTips website that goes into greater detail on this whole subject.
Example: Transforming Table Data Using Power Query
Picking up from where we left off last time, we will now perform a range of different transformation actions against the Sales.CustomerTransactions table from the WideWorldImporters sample database. The steps that follow are designed to give you a flavour of the types of transformation activities that you can perform against your data:
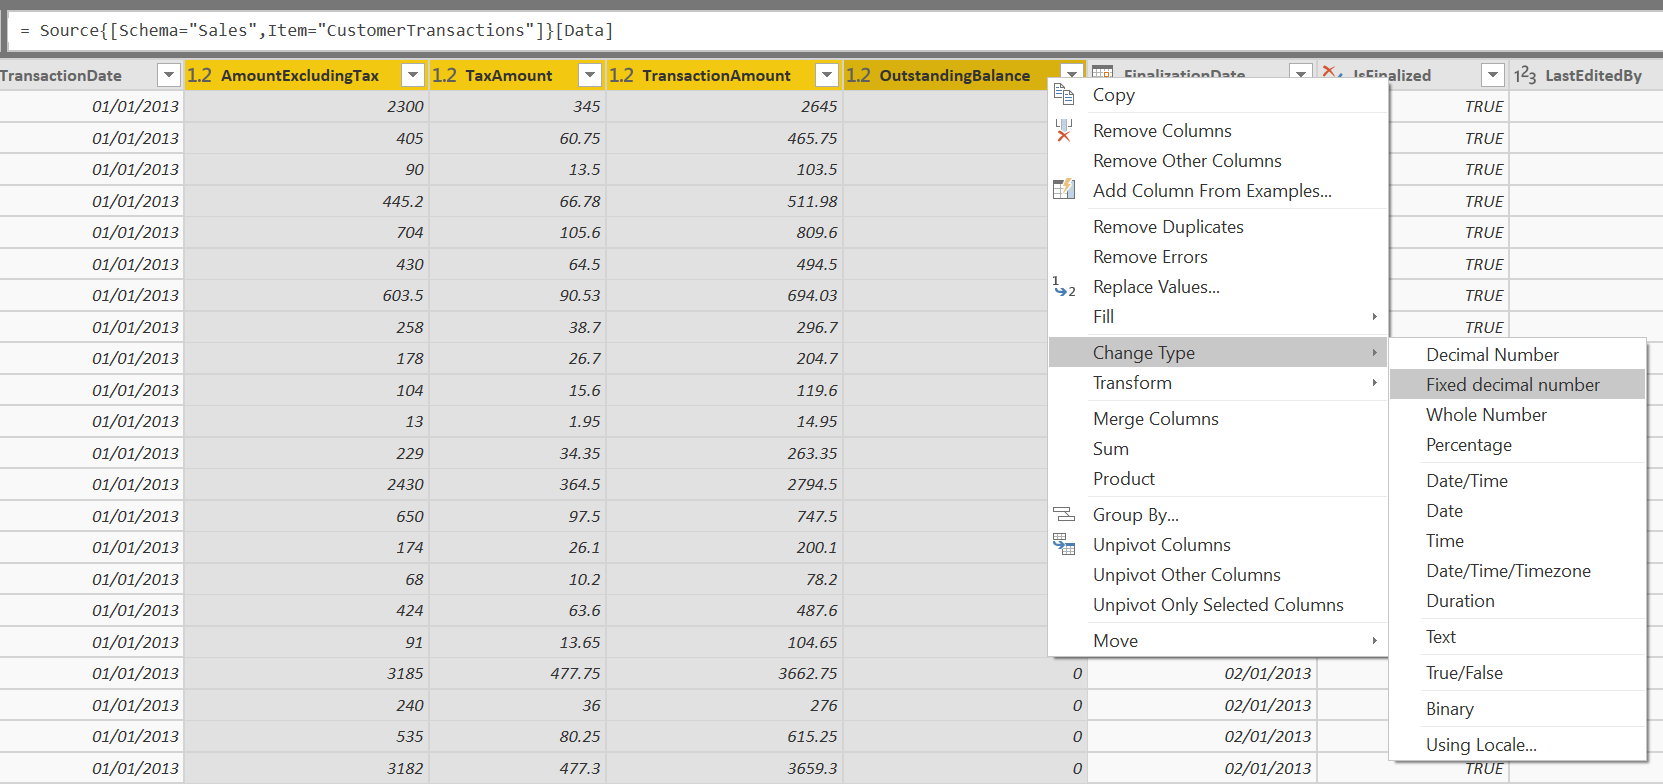
- Within Power BI Desktop, click on the Edit Queries button. The Power Query Editor window will open, listing all of the tables imported from the WideWorldImporters database. The Query Sales CustomerTransactions should already be selected but, if not, double-click on it to load the data from this data source into the main window:

- We can see in the main window that Power BI has automatically decided the best data types to use, based on the underlying SQL table schema. However, for all columns that relate to financial data (AmountExcludingTax, TaxAmount, TransactionAmount & OutstandingBalance), it will be more prudent to convert these into the most appropriate data type for currency values - Fixed decimal number. While holding down the CTRL key, left-click to select each of the columns mentioned above, right-click and select Change Type -> Fixed decimal number:
Notice now that a $ symbol appears next to each of the chosen fields. You can also see, on the right-hand pane, underneath Applied Steps, a new Applied Step called Changed Type:

As the interface is used to modify the data, the appropriate Power Query M code transformation occurs behind the scenes. All Applied Steps are reversible, and this can be done by highlighting it and pressing the X icon. It can also be renamed by selecting it and pressing the F2 button.
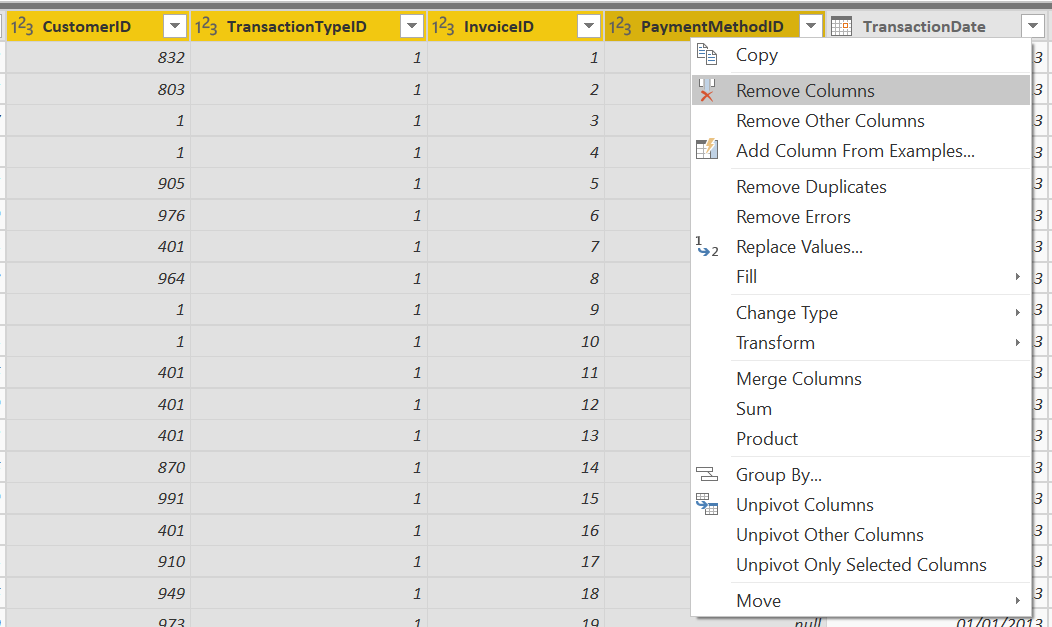
- Several columns have been brought over from the Sales.CustomerTransactions table that will not be particularly useful to end users, specifically:
- CustomerID
- TransactionTypeID
- InvoiceID
- PaymentMethodID
These can be removed by using the CTRL and left-click method, right-clicking any of the selected columns and selecting the Remove Columns option:
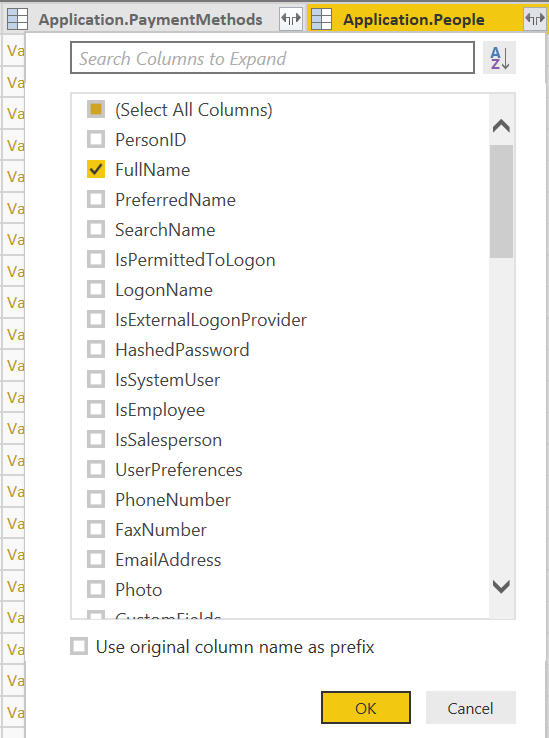
- Because we have imported data alongside other related tables, there will be some special relationship column types at the end of our table. An example of this is the Application.People field. For this example, we need to extract the FullName value from this table and include it as part of our current query, by clicking on the two arrows icon on the top left of the field, ticking the FullName field and pressing OK. You can (optionally) tick/untick the box at the bottom that says Use original column as prefix, which does exactly what it says on the tin:
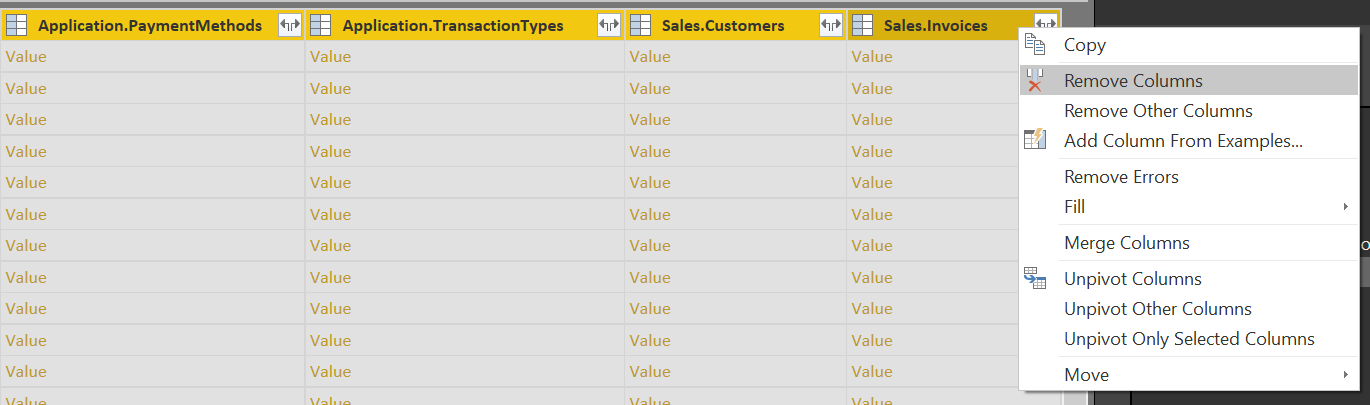
At this point, you can also remove all other relationship columns pictured below using the same method outlined in step 3:
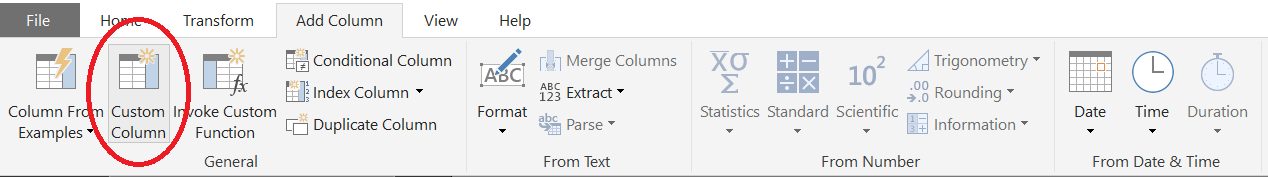
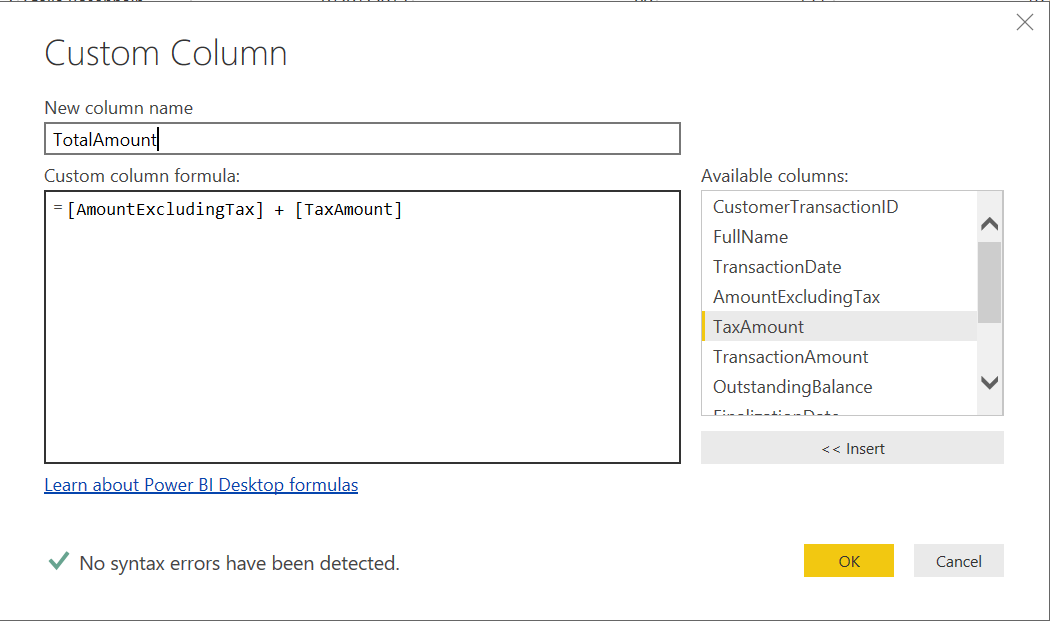
- The TransactionAmount field provides us with a total of each orders total value, by adding together the AmountExcludingTax and TaxAmount fields. Let’s assume for a second that this field does not exist in our data; in this scenario, it is possible to create a Custom Column that performs the appropriate calculation and adds this onto our table as a new field. On the Add Column tab, the Custom Column button is one way of doing this. Then, define the appropriate formula to add together both field values, using familiar, Excel-like syntax:
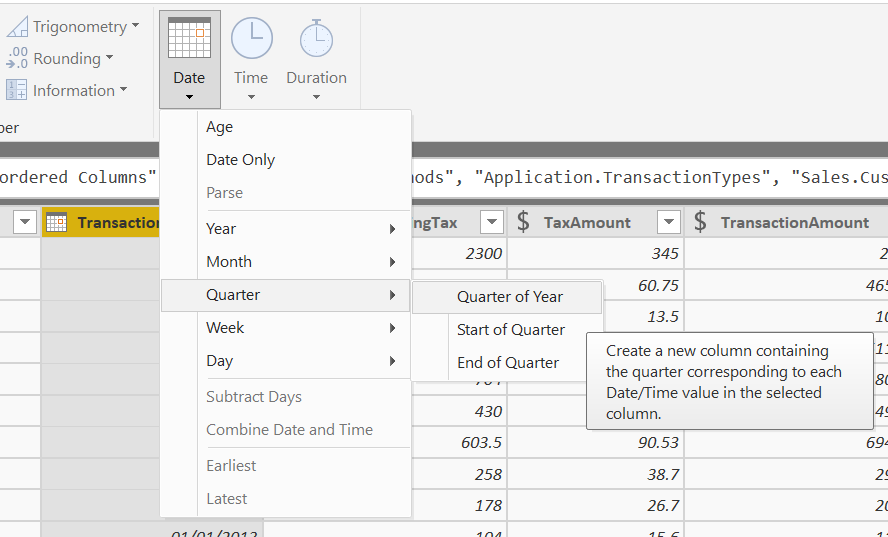
- A common requirement for reporting is the ability to report sales based on the quarter of the year. To meet this requirement, Power Query can extract information like this from a Date field with relative ease. With the TransactionDate field selected, go to the Add Column tab and select Date -> Quarter -> Quarter of Year:
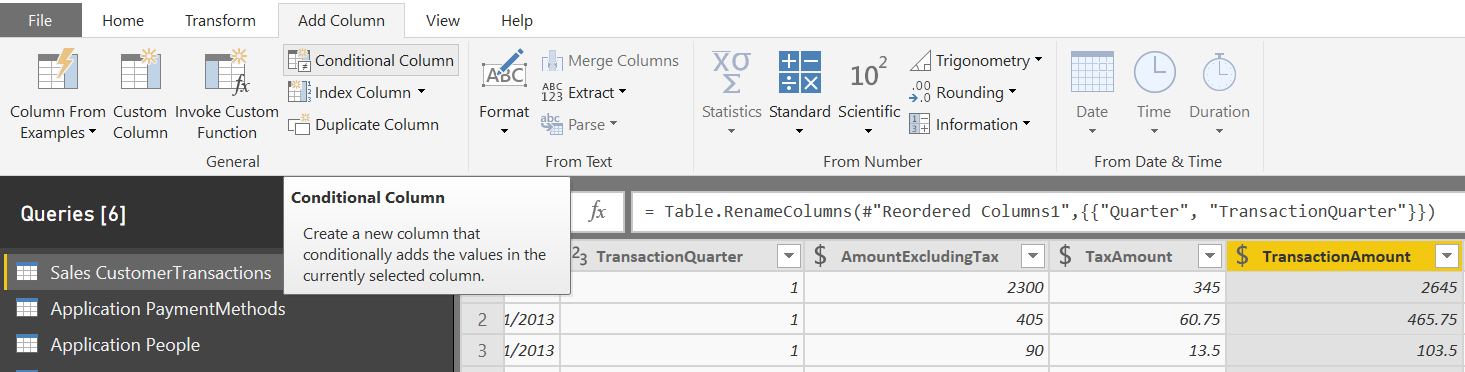
A new column called TransactionQuarter will be created, which can be dragged and dropped next to the TransactionDate field to keep things tidy:
![]()
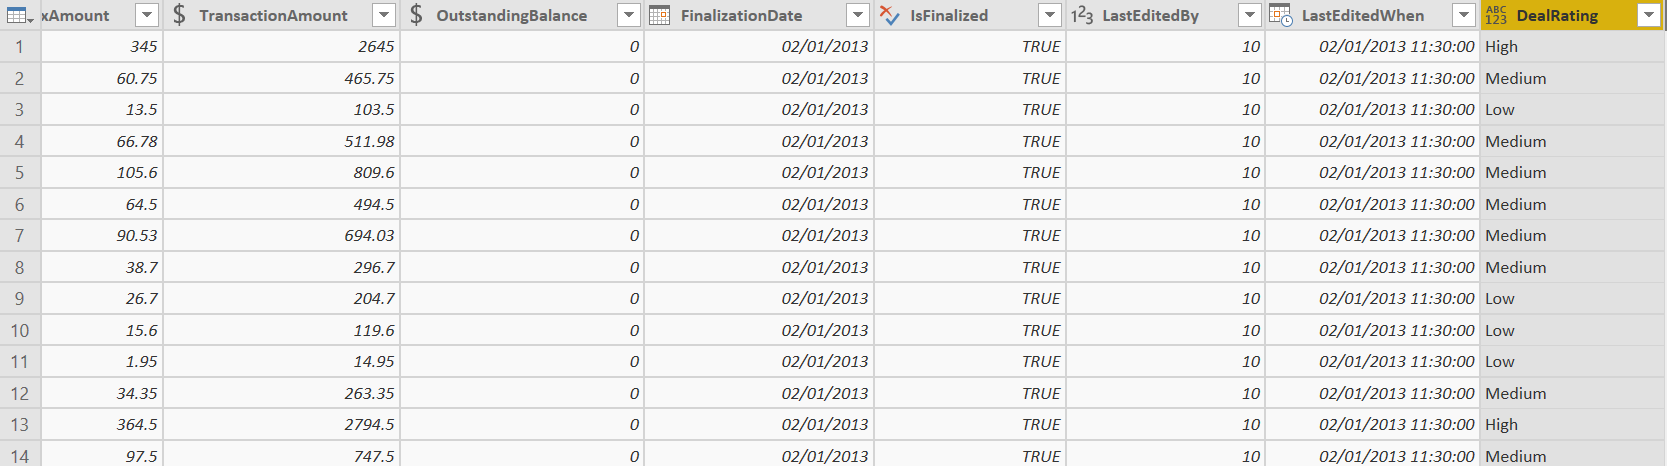
- Another common sales reporting requirement is being able to rank a particular sale by category. Again, Power Query can come to the rescue with the Conditional Column feature:
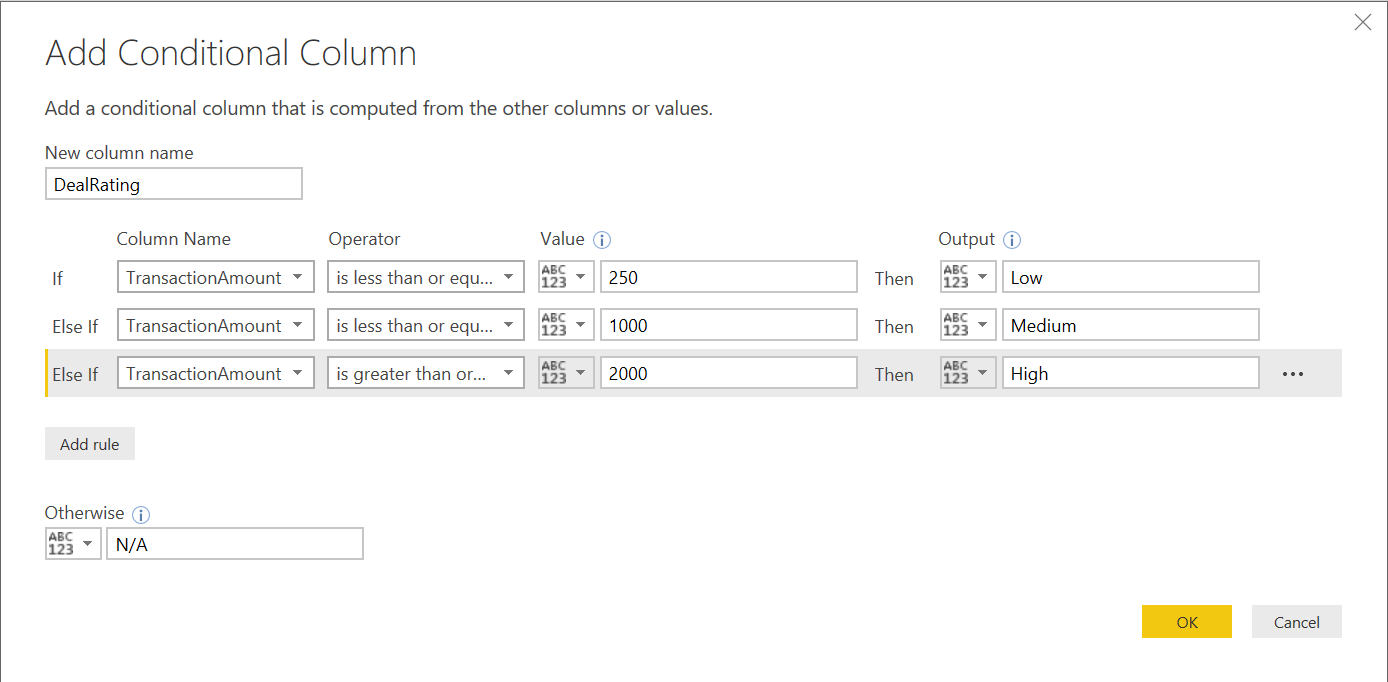
If you are familiar with if/else conditional logic flow, then the next part will be pretty straightforward 🙂 Within the Add Conditional Column window, populate each field with the field values indicated below and then press OK. You can use the Add rule button to include the additional Else if rows required for this field:
Once added, we can then view the field at the end of our table, working as expected:
At this point, our model is ready, but you could experiment further if you wish. Some additional transformation steps could include:
- Extracting the Month Name value from the TransactionDate field.
- Use the Split Column feature to extract the Forename and Surname from the FullName field, using Space as a delimiter.
- Filter the OutstandingBalance column to only include data where the value does not equal 0.
- Rename all columns and the Query itself to more human-readable names.
Key Takeaways
- The Power Query M formula language is used to perform transformations to data once loaded into Power BI. Although it is possible to do this via code, Power BI allows us to define all of our required data changes from within the interface, without the need to write a single line of code.
- Each data source connected to represents itself as a Query within Power BI. There are many options at your disposal when working with Queries, such as renaming, merging, duplication and the ability to disable or reference as part of other Queries.
- There are wide-range of column transformations that can be applied, which are too numerous to mention. The Transform tab provides the best means of seeing what is available, with options ranging from formatting through to grouping and pivoting/unpivoting.
- New columns are addable via the Add Column tab. You can choose to base new columns on calculations, conditional logic, other column values or as a defined list of ascending numbers, which may be useful for indexing purposes.
- It is possible to merge or append queries together to suit your specific requirements. Merging involves the horizontal combination of Queries, whereas appending represents a vertical combination.
- Parameters can be used to help optimise any complex filtering requirements.
- Where possible, Power Query will attempt to use the most optimal query for your data source, based on the transformation steps you define. This action is known as Query Folding and, in most cases, SQL-derived data sources will support this option by default.
In the next post, we will take a look at the options available to us from a data cleansing perspective and how it is possible to apply optimisation to a messy example dataset.