Welcome to post number 6 in my series concerning Microsoft Exam 70-778. The series aims to provide a revision tool for those who are looking at taking the exam and to also provide an introduction into some of the fundamental concepts around Power BI. As alluded to previously on the blog, Power BI is increasingly a topic that Dynamics 365 Customer Engagement professionals need to grapple with, particularly if they wish to implement a reporting solution that helps to ensure the long-term success of their CRM deployments. Going for Exam 70-778 gives you an ideal opportunity to familiarise yourself with this exciting technology area.
We moved into the Modeling and Visualizing Data theme for the first time last week, and we now jump into a relatively big subject this week - Create calculated columns, calculated tables, and measures. The skill areas covered here are as follows:
Create DAX formulas for calculated columns, calculated tables, and measures; Use What If parameters
To follow on as part of the examples that follow, make sure you have downloaded the WideWorldImporters sample database and hooked up Power BI Desktop to the tables described in my first post in this series.
Now, to begin this week’s post, we must first ask ourselves an essential question:
What is DAX?
Data Analysis Expressions, or DAX, has its roots in SQL Server Analysis Services (SSAS). First released as part of the PowerPivot for Excel 2010 Add-in, DAX has quickly become the preferred language to use when working with Excel PowerPivot, SSAS and - most importantly - Power BI. DAX bears a lot of similarity to standard Excel functions, but a critical differentiator is that DAX does not operate in the context of cells and is considered a strongly typed language (i.e. can lead to a higher risk of errors at runtime). A benefit of using DAX over PowerQuery/M is that the language handles a lot of data conversions implicitly. It also supports the usual list of data types associated with SQL type databases - Decimal/Whole Numbers, DateTime, Text, Boolean etc. A successful Power BI Reporting solution typically relies heavily on the building of complex DAX formulas, which are then complemented by the most appropriate visualisation at the report level.
Context in DAX
An important concept to grapple with DAX is that of context, and how this applies to the various formulas that you build out. There are two types of context:
- Row Context: Essentially meaning the “current row”, functions that operate in this manner will be processed for every single row on your dataset, outputting the result required each time. For example, the IF function works on a row context.
- Filter Context: Functions that support this will take into account any filters defined at the report level when performing the relevant calculation. Consequently, a lot of the work involved in contextually updating visuals is handled automatically by your DAX formulas, with no need to configure specific Measures/calculated columns as a workaround.
It is essential to understand these two types of context and on how they can impact on each other (the “context transition”). More critically, it’s also crucial to be aware of when a DAX function ignores a context completely. For example, some aggregation functions completely ignore row context. This article on the SQL BI website is a great resource that discusses this whole topic in depth.
Utilising DAX in Power BI
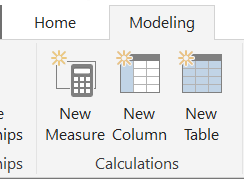
The Modeling tab is your go-to area when working with the three types of DAX calculations within Power BI Desktop - Measures, Calculated Columns and Calculated Tables:
The sections that follow will discuss each of these in further detail, but there are some useful points to highlight that apply when using DAX generally:
- Unlike the M Query Editor, there is full Intellisense support provided for DAX within Power BI. Straightaway, this makes this a much more streamlined tool that should be gravitated towards automatically as a consequence.
- You should always use fully-qualified names that reference both the table object and field name that you are attempting to access. An example of how this should look can be seen below with the custom column EditedByDay on the WideWorldImporters Sales.OrderLines table:

- It is also possible to add comments to your DAX code, with three flavours on offer; this is the part where we distinguish between the C# and SQL Server developers 🙂 :
- Single Line Comments: // or --
- Multi-Line Comments: /* and */
The screenshot below indicates how to utilise these as part of a DAX calculated column:
- 
Let’s take a look now at the specific areas referenced above in greater detail:
Measures
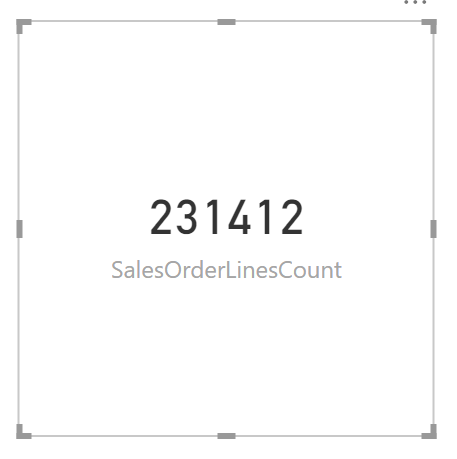
Measures are best thought of as being fixed (or scalar) values, typically aggregations based on simple or more complex underlying formulas. A straightforward example could be just a Count of all rows on a table e.g
- SalesOrderLinesCount = COUNTROWS(‘Sales OrderLines’)
Although Measures are compatible with any Visualization, the most common place to find them will be in a Card, as indicated below:
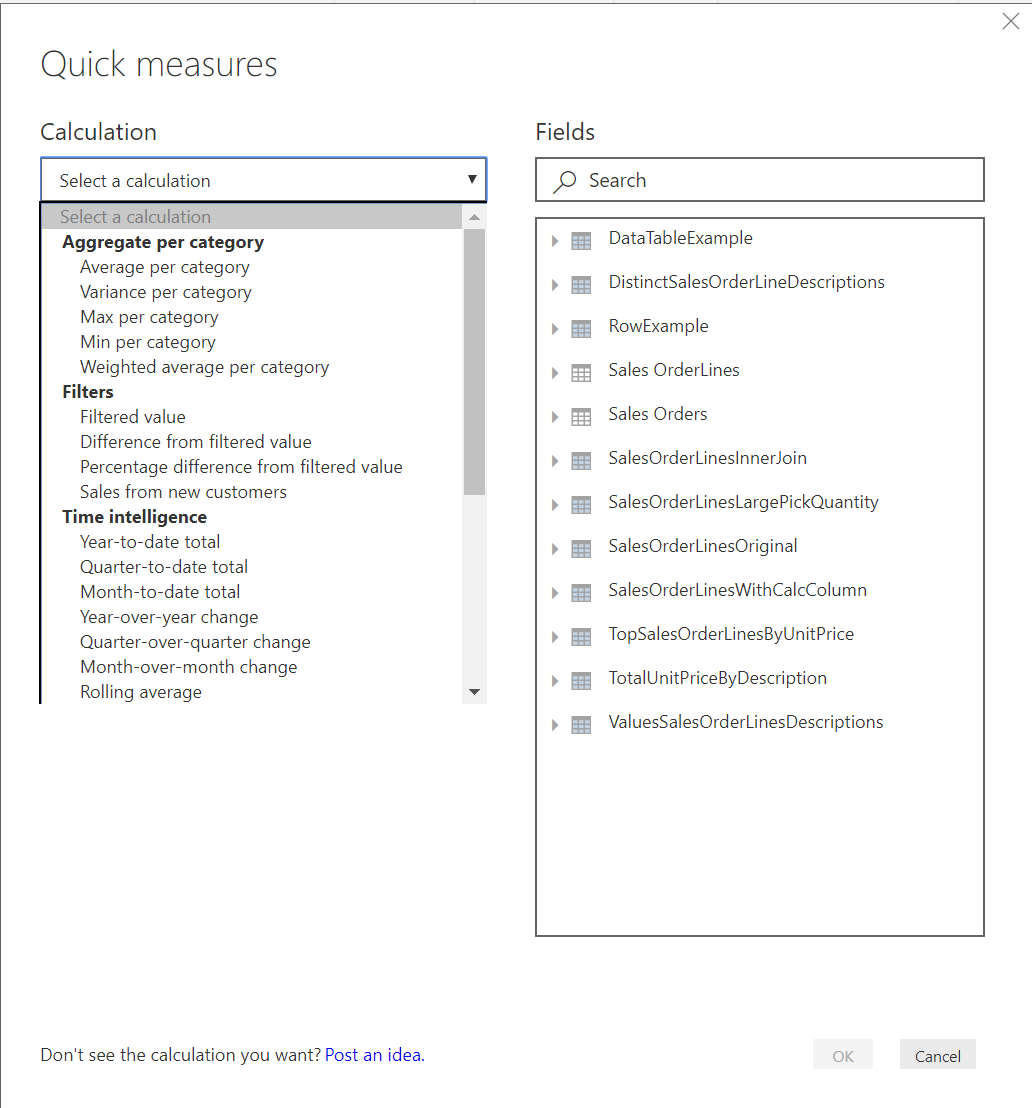
When first working with Measures, an advantageous feature at our disposal is the New Quick Measure option, which provides a softer, GUI-focused approach to creating common types of Measure:
Beyond this, the sky is the limit when working with DAX Measures, with a whole range of different functions that can be used in isolation or tandem with each other.
Calculated Columns
We saw how it is possible to perform simplistic custom/calculated columns using the Power Query Editor as part of an earlier blog post. The functionality offered here can prove useful for straightforward requirements - for example, if Column1 equals “AAA”, then TRUE, else FALSE - but may soon become insufficient if you have more advanced needs for your new column. In this scenario, DAX calculated columns could come to the rescue and give you the ability to more familiarly define your business logic, particularly for those with their Excel head on.
A key consideration when working with DAX Calculated Columns is understanding the impact they have on performance; specifically, that they consume RAM and disk space within your report. You should be aware also of the concept of circular dependencies. It is possible to build highly complex formulas within DAX, that may reference other DAX columns that you have built out. As a consequence, attempting to modify any dependent DAX formulas could result in errors. In addition to this, trying to define multiple calculated columns that perform the same operation may also lead to circular dependencies. There is another excellent article on the SQL BI website that jumps into this whole subject area in greater detail and is worth a read.
Similar to Measures, pretty much every type of DAX function listed here (minus ones that return table values) is useful in some way when working with Calculated Columns.
Calculated Tables
The types of DAX functions discussed so far focus on returning a single value - either in the sense of a fixed, often aggregated, value as part of a Measure or a single value on a row-set with a Calculated Column. The next step up from that, and where DAX enters a whole new realm of usefulness, is the ability to define Calculated Tables based on DAX formulas. There are a LOT of options at your disposal here. As well as being able to derive Calculated Tables directly from other objects within your model (e.g. the DAX formula SalesOrderLinesDupe = ‘Sales OrderLines’ would create a copy of the Sales OrderLines table), there is also a wide array of different functions available that, when used individually or in combination, can satisfy any particular requirement:
-
The FILTER function returns a new table object filtered from another, based on a specific value. The CALCULATETABLE function is the “big brother” of this particular function, with the ability to define multiple, potentially complex filter conditions.
-
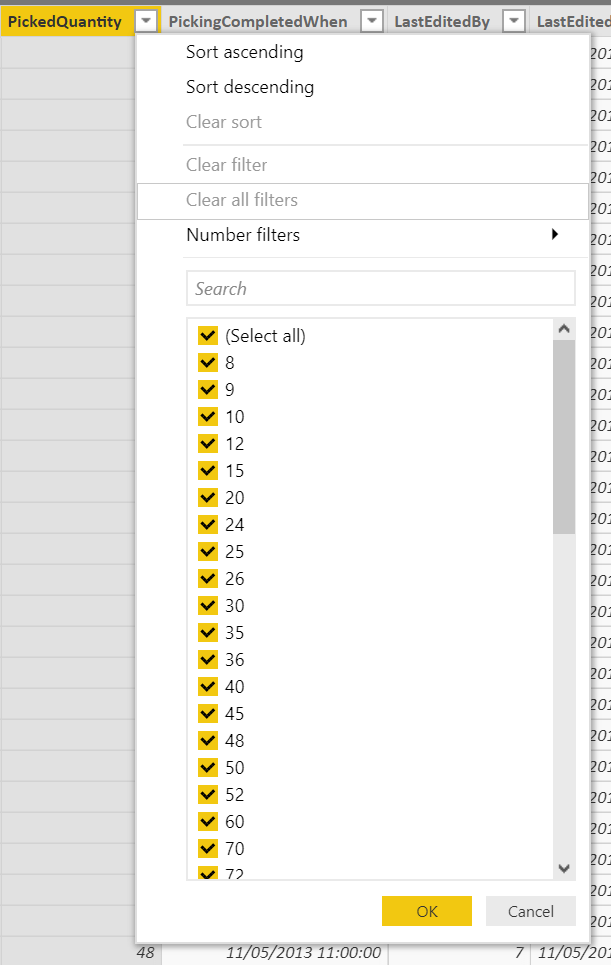
The ALL function returns all data from a table with underlying filters removed (i.e. filters that are defined using the options indicated in the screenshot below. It can be used to specify a whole table or single/multiple column(s). There are also variants of this, such as ALLEXCEPT (which will return all columns except the ones listed) and ALLNOBLANKROW (which removes any blank rows before returning the data).
-
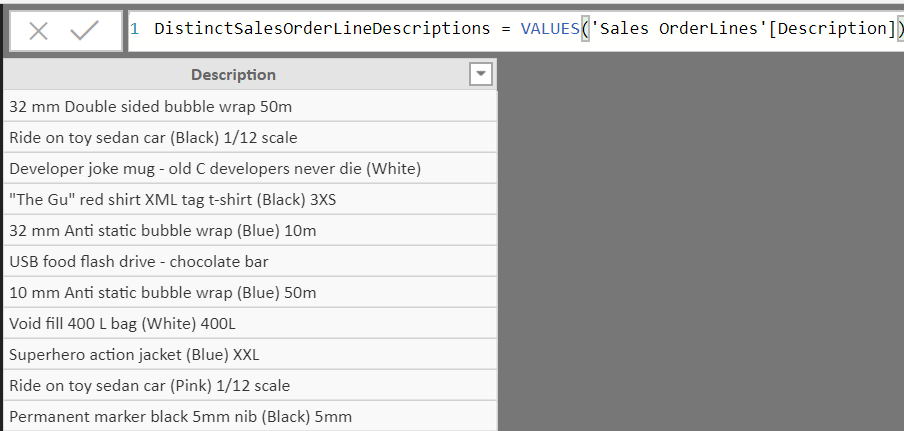
VALUES and DISTINCT return a list of distinct rows only. VALUES can only work with physical tables, whereas DISTINCT also works with table expressions.
-
SUMMARIZE groups a table by one or more columns, adding new ones where necessary. The grouping is optional. Only rows that contain data will return.
-
ADDCOLUMNS returns an existing table with new columns defined, typically as DAX formulas. SELECTCOLUMNS behaves similarly, but you have to specify the columns to return, including any new ones.
- e.g. SalesOrderLinesWithCalcColumn = ADDCOLUMNS(‘Sales OrderLines’, “IsEndOfMonth”, IF(DAY(‘Sales OrderLines’[LastEditedBy]) >= 25, TRUE(), FALSE())) returns the Sales OrderLines table, with the example IsEndOfMonth column included as a new column based on a DAX formula.
-
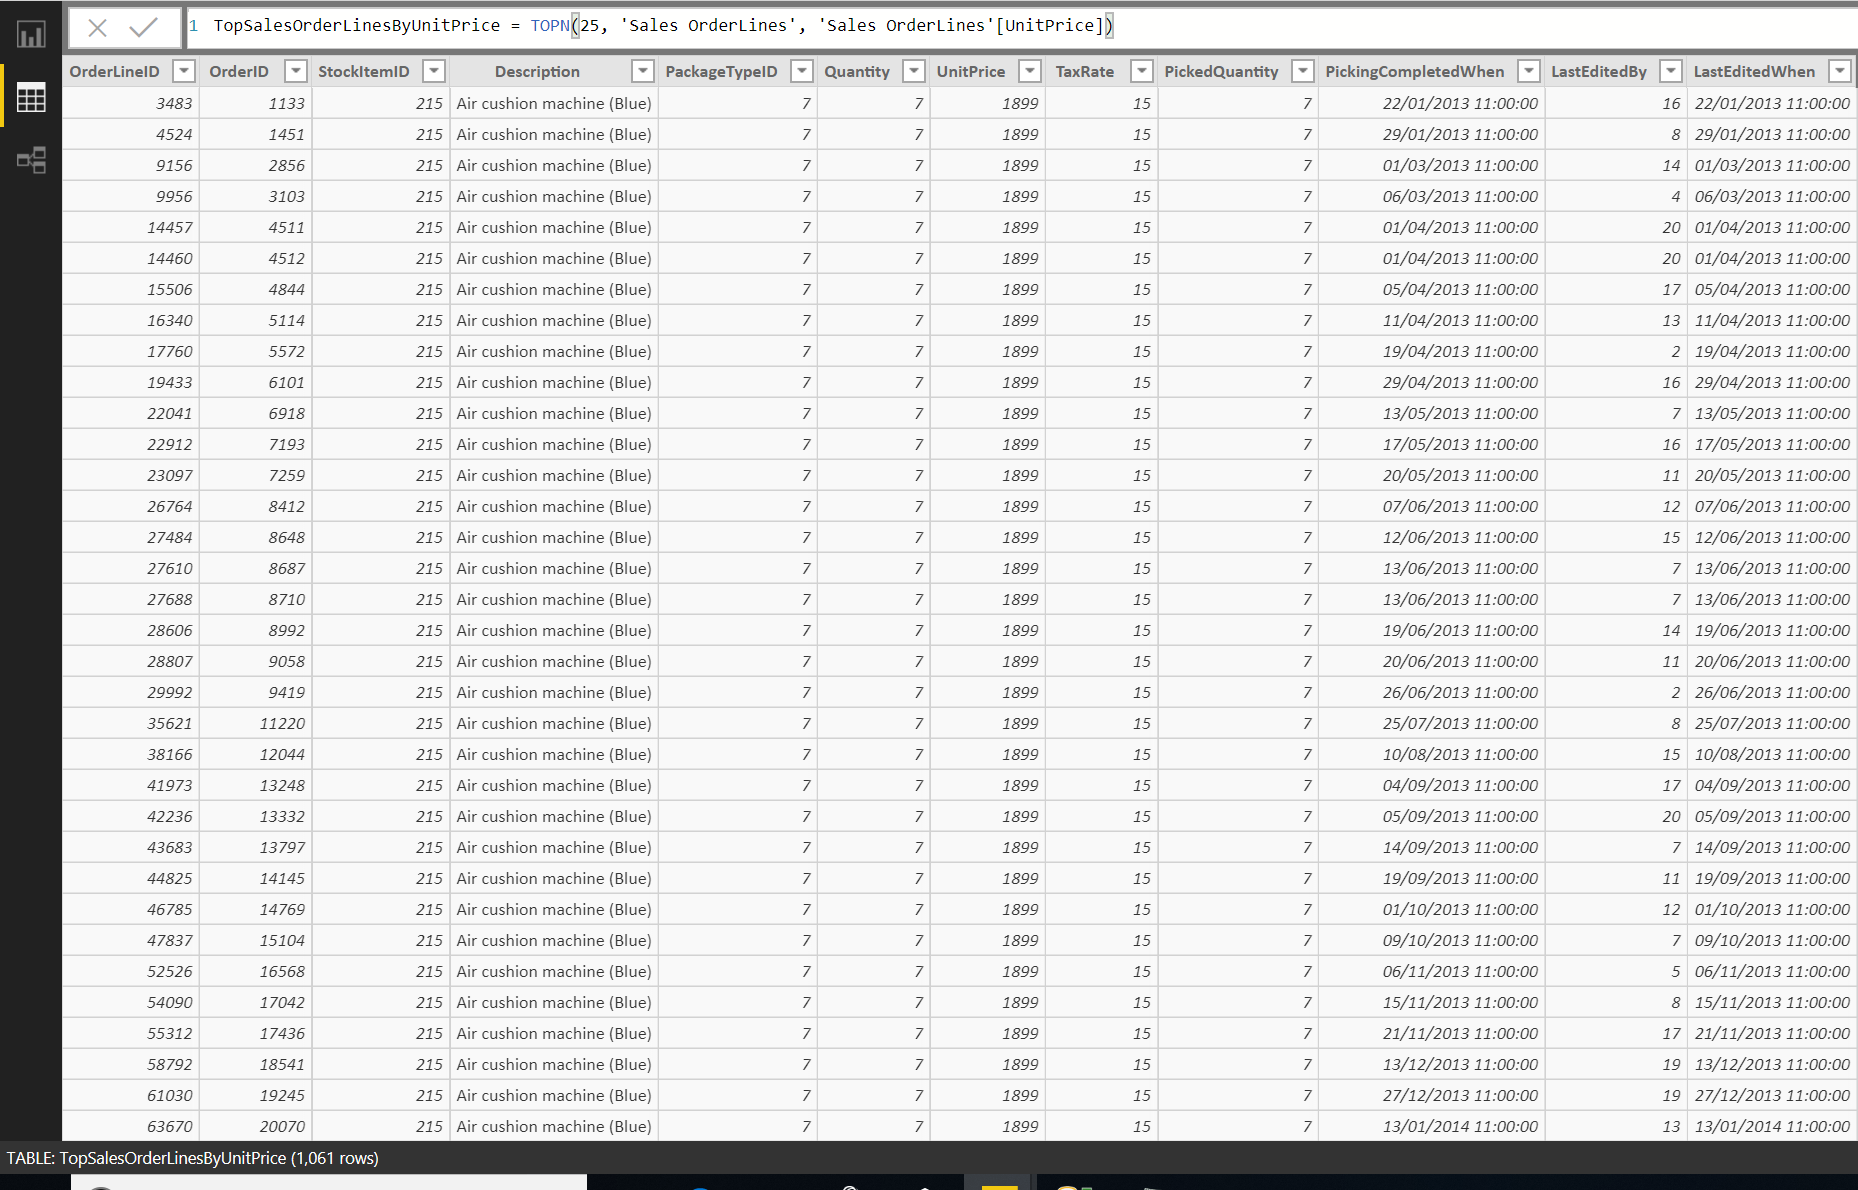
TOPN performs ranking based on conditions and returns the specified number of records based on the ranking criteria. Ties can also occur, meaning that the specified ranking number may not correlate to the actual number of rows returned.
-
There are a range of functions available to accommodate common table-join scenarios. CROSSJOIN allows for Cartesian product joins from multiple tables; NATURALINNERJOIN & NATURALLEFTOUTERJOIN perform self-explanatory joins, which seasoned SQL Server developers should have no trouble in guessing; and GENERATE & GENERATEALL allow for more bespoke table joins to take place.
-
GENERATESERIES creates a single table with a list of numerical values. It requires the start & end number and the (optional) increment value.
- e.g. SeriesExample = GENERATESERIES(1, 150, 1) will generate a single column table object with 150 rows, numbered 1 to 150.
-
CALENDAR generates a list of date/time values in a single table column object, based on the range specified. CALENDARAUTO behaves the same but creates a list of relevant date values after evaluating the whole model (e.g. if there is another table with dates between January 1st and November 31st 2018, then this would be the list of dates generated).
- e.g. Using CalendarAuto with the WideWorldImporters Sales Orders and Sales OrderLines tables will create date values from the 1st January 2013 through to the 31st November 2016.
-
ROW generates a single row table with the column values specified, based on a key/value pairing.
-
UNION combines two or more tables vertically, retaining duplicates. Column names do not need to match, but the number of columns does. INTERSECT is similar to UNION but maintains only values that exist the same in both tables. Nested UNIONS are usable alongside this, but the specified order can impact the result. EXCEPT is similar to UNION and INTERSECT, but outputs rows that exist only in the first table, not the second one.
-
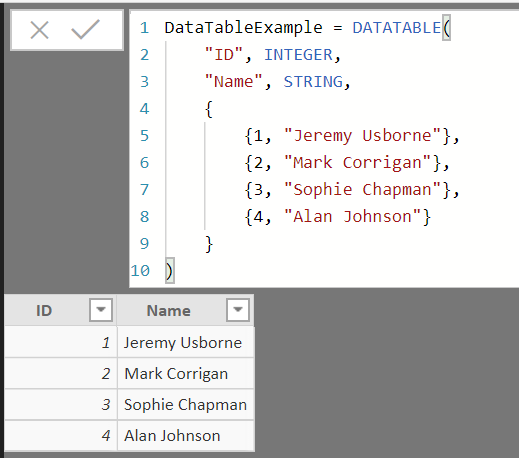
DATATABLE allows the user to specify tables that contain manually entered data, similar to the Enter Data feature:
What If Parameters
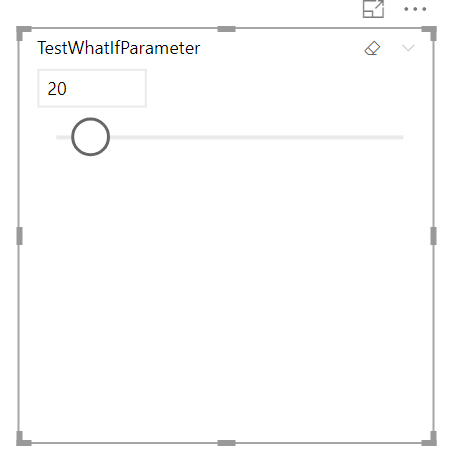
There may be times within Power BI where you need to provide some predictive modelling capability. For example, show how potential sales will look based on an increased margin of 25%. Or it could be, as developers, we wish to test the functionality of some of our DAX formulas by having the ability to see how potential ranges of values will affect our calculations. For either scenario, What If Parameters can provide a solution. By default, on creation, a slicer control is provided that can be placed anywhere on your Report. To create a What If Parameter:
-
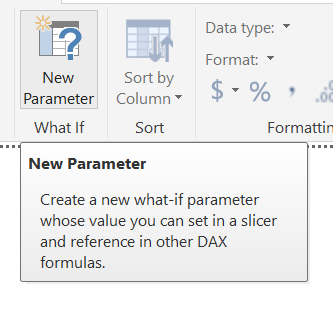
Within Power BI Desktop, on the Modeling tab, select the New Parameter option:
-
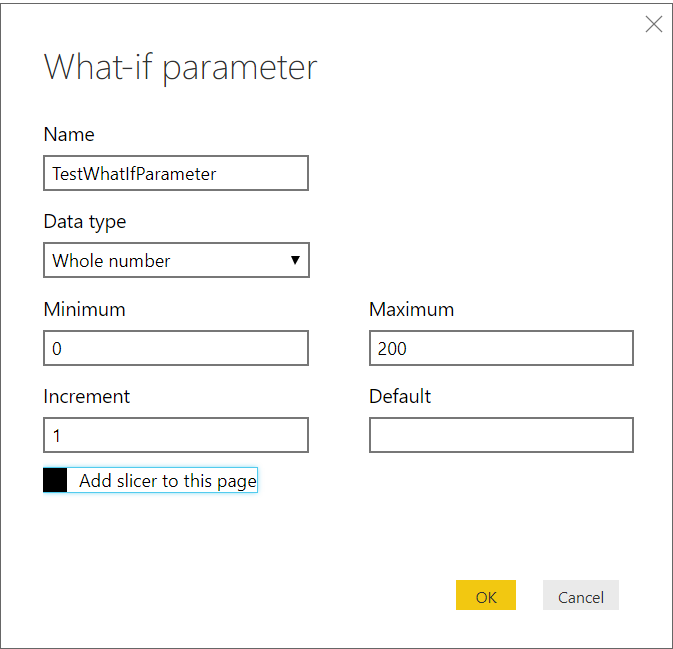
On the What-if parameter dialog box, enter the details as indicated below and press OK:
-
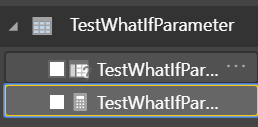
This will then add the following components to your report:
-
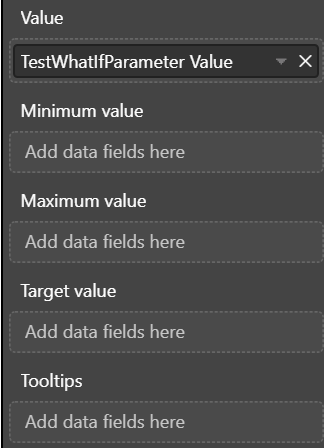
Under the Visualizations tab, select the Gauge visualization to add it your report. Define the properties for the Gauge visual as follows:
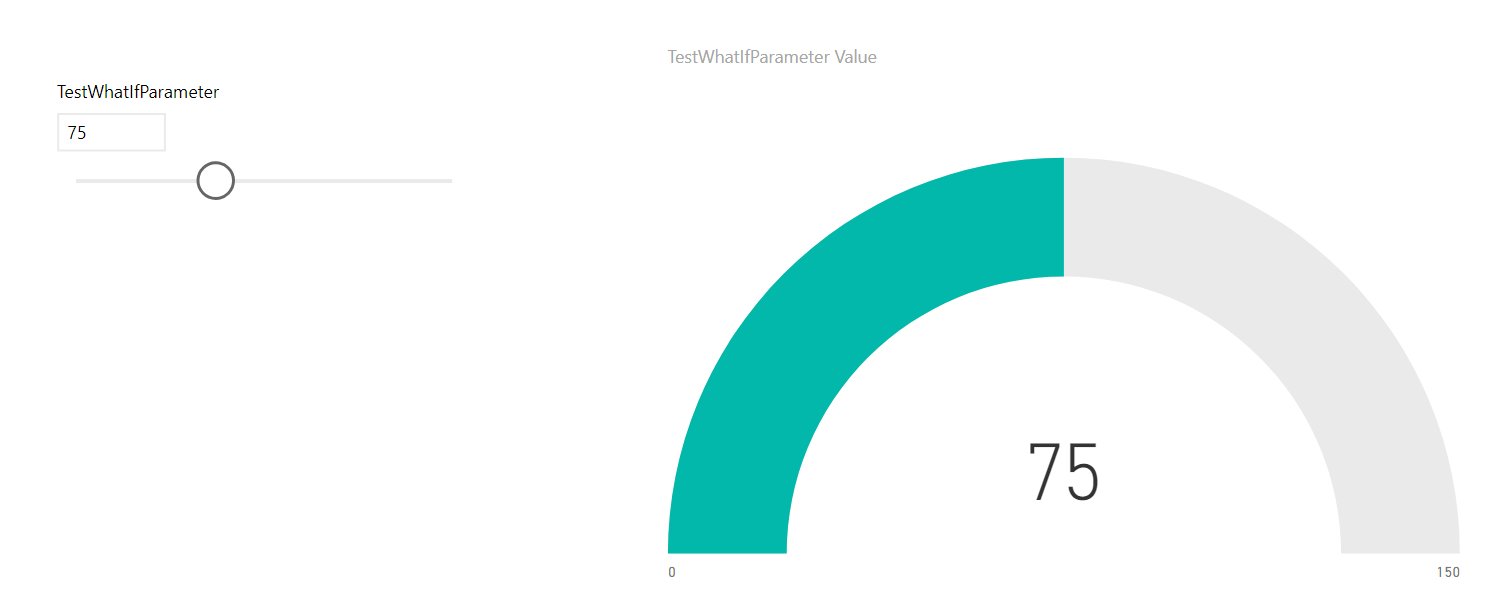
- Now, when you adjust the value in the TestWhatIfParameter, the Gauge will update accordingly. For example, setting it to 75 will update the report as follows:
This simple example does not do justice to the potential that this feature has, so I would recommend exploring it further yourself.
Key Takeaways
- DAX is the primary formula language when working with datasets outside of Power Query. It includes, to date, more than 200 different types of functions that can assist in all sorts of data modelling.
- An important concept to grasp within DAX is context and, specifically, row context (formulas that calculate a result for each row in a dataset) and filter context (formulas that automatically apply any filtering carried out at report level).
- The sheer amount of DAX functions available makes it impossible to master and remember all of them, particularly when it comes to the exam. Your learning should, therefore, focus on learning the general syntax of DAX and the general types of functions available (aggregation, date/time etc.)
- There are three principal means of utilising DAX with Power BI:
- As Measures: These typically present a scalar value of some description, often an aggregation or a result of a complex formula. Using them in association with a Card visualization type is recommended, but this is not a strict requirement.
- As Calculated Columns: Similar to the options available within Power Query, Calculated Columns provide a dynamic and versatile means of adding new columns onto your datasets. Compared with the options available within Power Query and the complexity of the M language, DAX Calculated Columns might represent a more straightforward means of adding custom columns onto your datasets.
- As Calculated Tables: A powerful feature, mainly when used in conjunction with Calculated Columns, you have the ability here to create entirely new datasets within the model. These will typically derive from any existing datasets you have brought in from Power Query, but you also have functionality here to create Date tables, sequence numbers and manually defined datasets as well.
- What-if Parameters provide of means of testing DAX formulas, as well as allowing report users to perform predictive adjustments that can affect multiple visualizations on a report.
DAX is a subject so vast that there are entire books devoted to it. Therefore, from an exam perspective, don’t worry too much about becoming a DAX master. In next weeks post, we’ll hopefully go down a few gears as we take a look at how to work with KPIs and how to apply them to visualizations.

