
Welcome to the ninth post in my series focused on providing a set of revision notes for the PL-400: Microsoft Power Platform Developer exam. In the last post, we looked at the second type of Power App available to us, model-driven apps, and how we can best leverage them to meet particular scenarios. With this topic covered, we should now have a good grasp of how to create a Power App. But this is only one area that we, as developers, must be responsible for; we must also ensure we leverage the tools available to diagnose and resolve problems that arise with our apps. This musing leads us rather conveniently into the next exam area, Manage and troubleshoot apps, which includes the following skills measured:
Manage and troubleshoot apps
- troubleshoot app issues by using Monitor and other browser-based debugging tools
- interpret results from App Checker and Solution Checker
- identify and resolve connector and API errors
- optimize app performance including pre-loading data and query delegation
Microsoft has recently made several investments in this area, meaning that we are in the best position than ever before to resolve issues with our apps. Let’s dive in and see what’s available.
As with all posts in this series, the aim is to provide a broad outline of the core areas to keep in mind when tackling the exam, linked to appropriate resources for more focused study. Ideally, your revision should involve a high degree of hands-on testing and familiarity working with the platform if you want to do well in this exam.
What is Monitor?
Often, when attempting to figure out why we’re getting a specific error in our app, we can get frustrated when determining the precise cause. Compounding this problem further is when the issue occurs for a particular user, and you cannot replicate it yourself. The Power Apps Monitor aims to address these scenarios and more by letting us view the entire log activity for our apps as other users, or we perform specific actions within them. It can also be beneficial from different perspectives too. For example, if your app runs very slowly, you can use the Monitor to detect the amount of time it takes for data to be loaded and verify what we’ve brought back each time. Through this analysis, you can identify mechanisms to filter your data or explore potential options to cache data locally instead. It’s worth noting you can use the Monitor with both model-driven and canvas Power Apps, and there are some crucial restrictions regarding its usage that you should bear in mind. There may also be situations where you must refer to browser-based debugging tools instead of Monitor to troubleshoot your issues, such as those involving model-driven app form script errors or tabs/sections not appearing correctly. Microsoft provides a whole article that you can refer to in these circumstances.
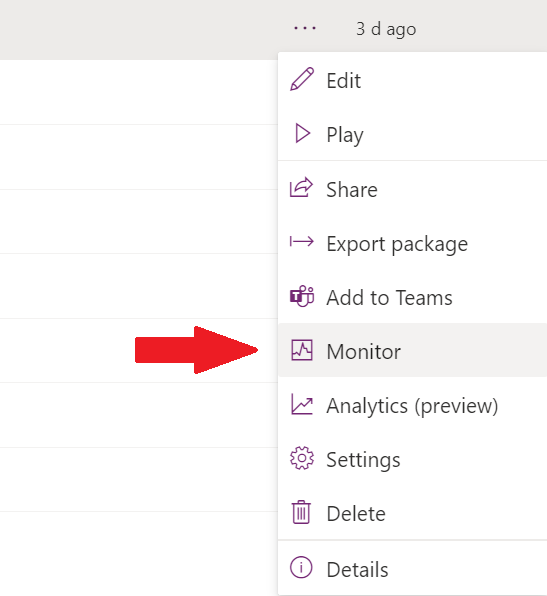
You can get started with Monitor by simply right-clicking your app in the Maker portal and selecting the appropriate option:
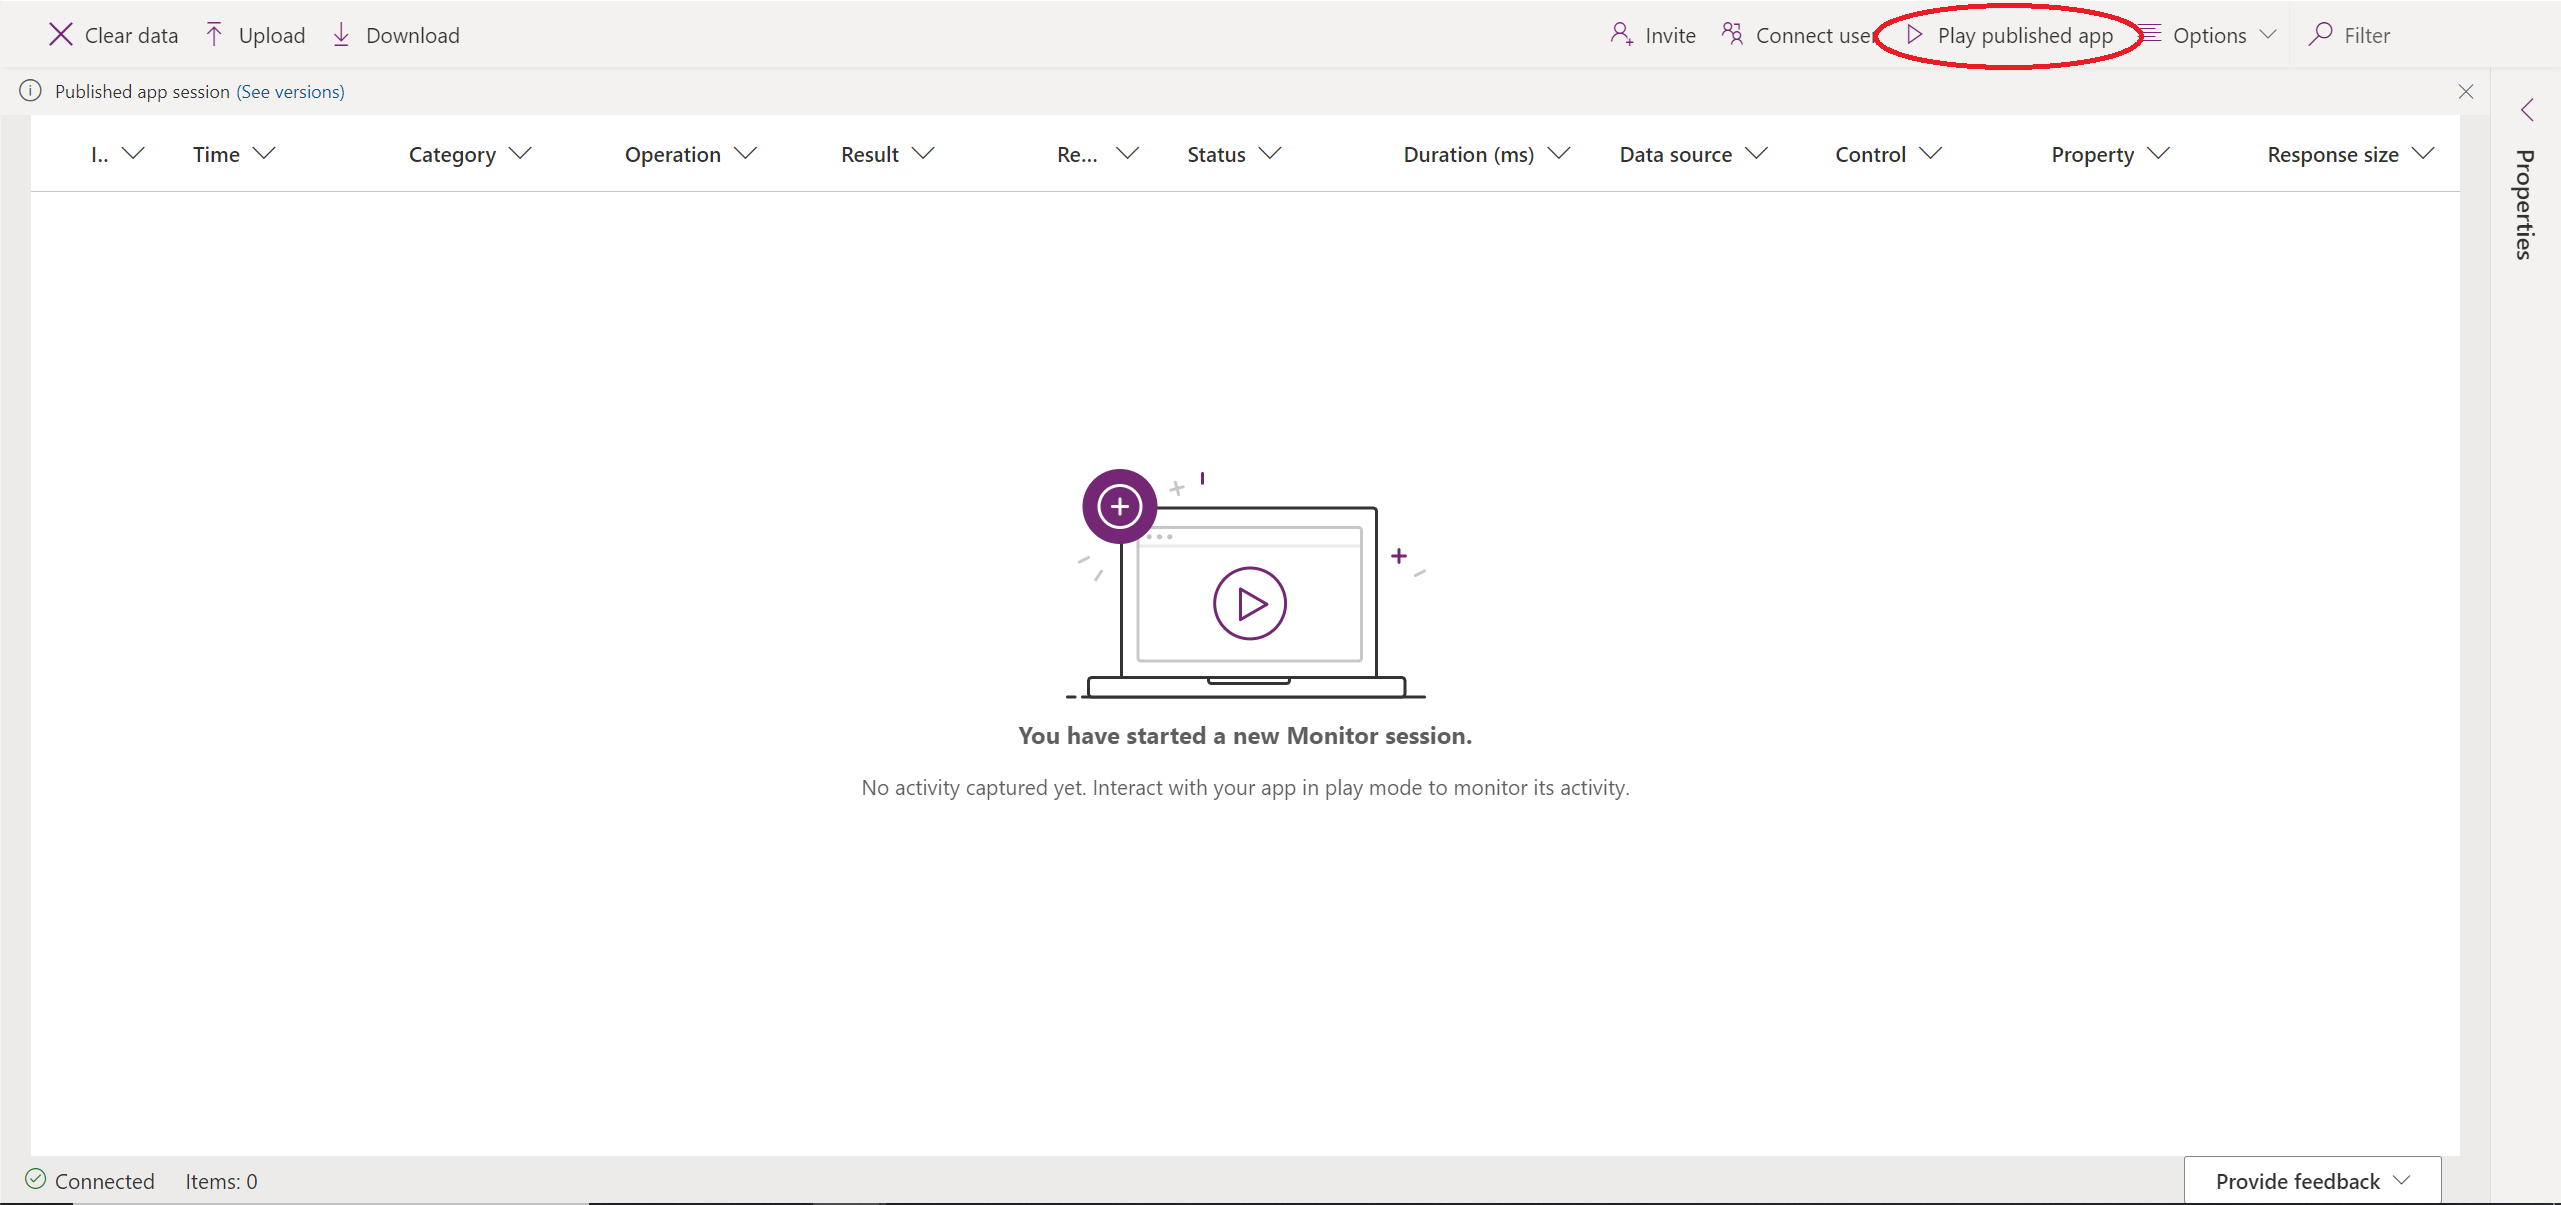
Once launched in a browser tab, you can then start to run your app within another browser tab by selecting the Play published app button in the top right of the screen:
From there, you should start to see data populating through:
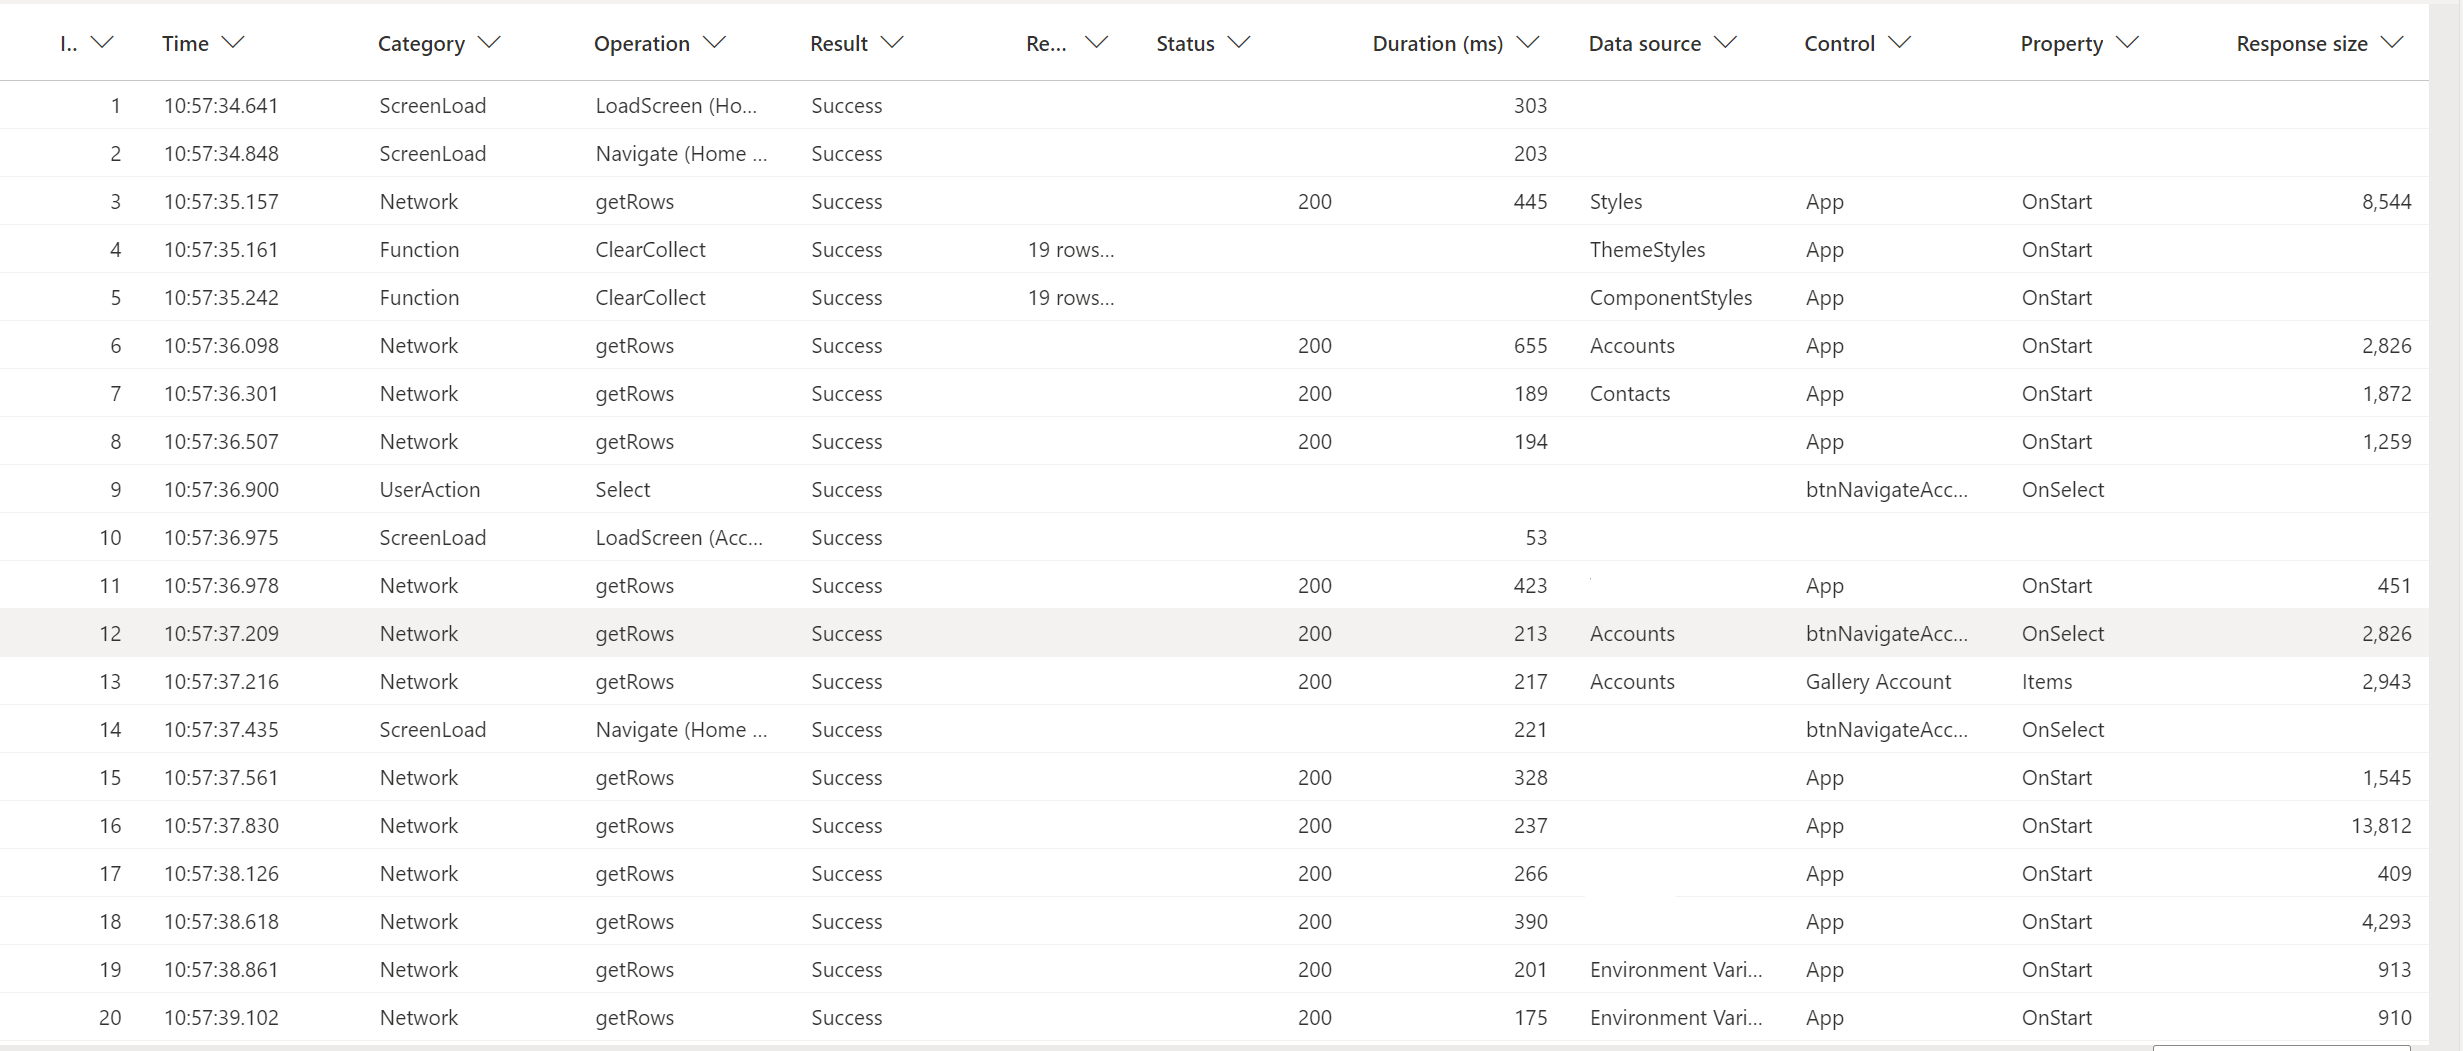
The actual output will vary significantly, depending on what your app is doing. But each core event will return the following properties that you can inspect:
- Details: This will provide high-level summary information points, such as the status, response type, size and any corresponding data.
- Formula: This will show the evaluated formula alongside the appropriate event handler that we attached to it.
- Request: When your action involves retrieving data from an external system, this tab will appear and show the raw request details in JSON format. You can also view the appropriate HTTP status codes for the request, which can be particularly useful in starting to identify issues with a specific connector or authentication mechanism leveraged.
- Response: This final tab will show the raw data received from the corresponding request, if successful.
The Monitor can help in the context of development, but even more so when you invite or connect users up to the tool. By taking this step, we can then perform remote debugging of the app, often identifying specific problems that we cannot replicate elsewhere. In short, Monitor can be a flexible and powerful tool in your arsenal when used correctly.
Using App Checker to Make Accessible Canvas Apps
These days, an app developer’s vital concern is to ensure their apps are functional and meet accessibility requirements. The individuals using our applications can often have diverse needs we must be conscious of and provide support for proactively. For example, individuals with vision impairment may require screen reader software to interact with an application and its underlying data. Ensuring, therefore, that we have configured appropriate labels for each of the controls within our app will ultimately ensure that these individuals can work without further assistance required.
To help support us in this objective, we can leverage the App Checker within the canvas Power Apps Studio to identify these issues and others relating to formulas, runtime errors, rules, and performance. Remember that, unlike the Monitor, the App Checker is available for canvas Power Apps only. We can access the Checker straightforwardly enough by selecting the appropriate button within the studio:
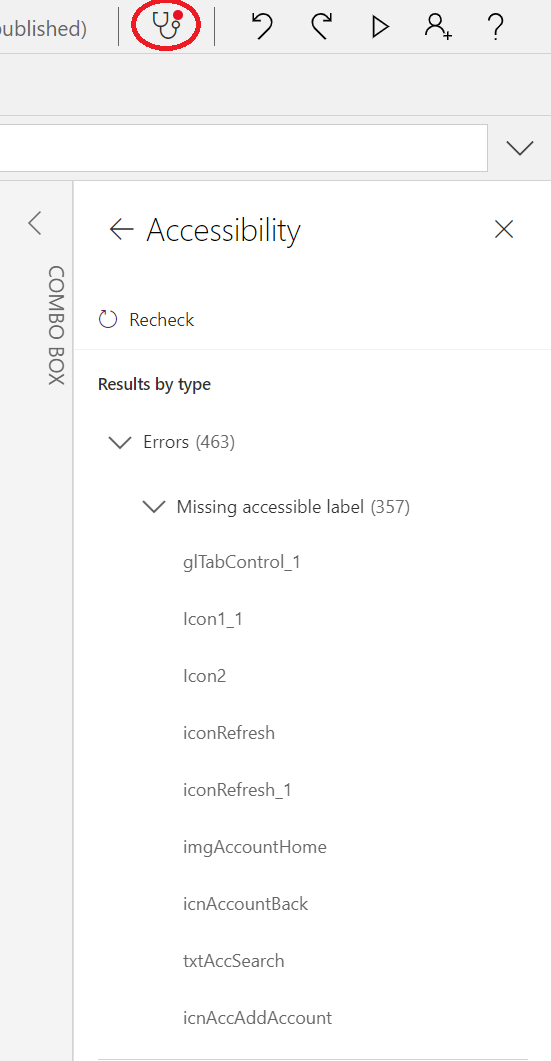
In this case, as we can see, we are missing accessible labels from numerous controls within the app. So perhaps I need to practice what I preach a bit more! 😅😳 Developers can click onto each highlighted issue to quickly load the offending control and provide the appropriate fix. Once a developer has built their first canvas app, they should carefully review the App Checker output to understand the things to fix; from there, you can use the App Checker as a quick, final step for any new apps, to ensure you’ve not overlooked anything.
Solution Checker Overview
As developers, we should always have “best practice” approaches discussed earlier top of mind as part of our daily work. Particularly when it comes to putting together coded solutions involving JavaScript or C# within Microsoft Dataverse and model-driven Power Apps, we should avoid situations where we are:
- Using parallel execution patterns within our plug-ins.
- Specifying all columns to be returned as part of a Retrieve or RetrieveMultiple request within a plug-in
- Leveraging non-strict equality comparisons within JavaScript
- Using console.log in production-ready JavaScript code
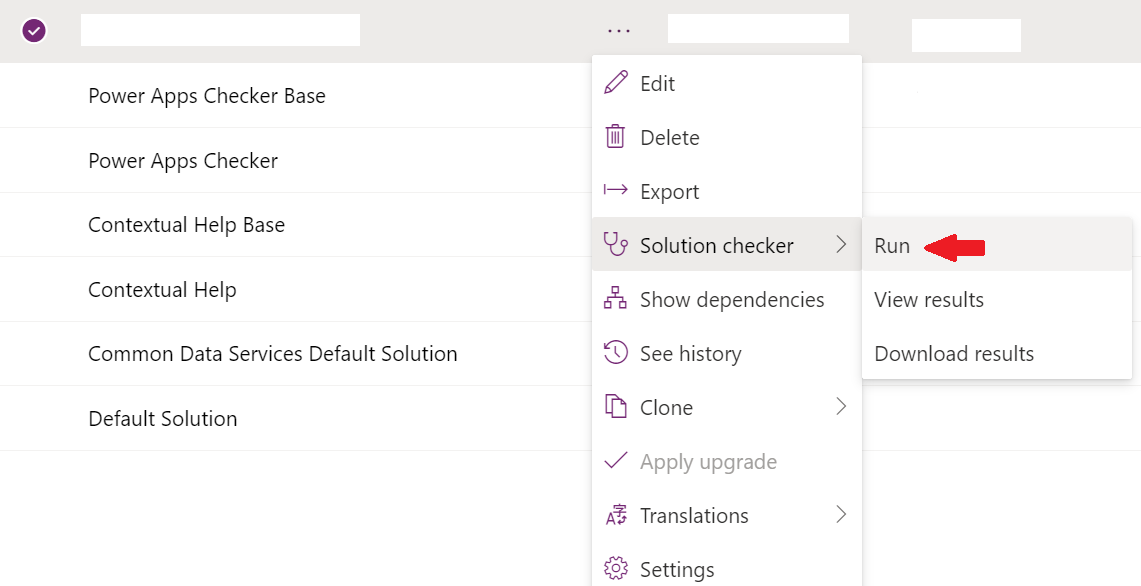
These “best practices” typically consist of a mixture of industry recommendations and specific recommendations made by Microsoft, based on their extensive history supporting these applications within the cloud. And now, thanks to the capabilities on offer as part of the Power Apps Solution Checker, we can very straightforwardly identify these issues as we are working with the platform each day. We can run the Solution Checker at any time within the maker portal by selecting our unmanaged solution and then the appropriate option:
The check usually takes a couple of minutes to run to completion and, from there, you’ll be able to review and consume the results. Any issues flagged by the App Checker will also surface here, therefore allowing you more than ample opportunity to identify the problem before moving your app forward into production 😉. I recommend running the Solution Checker before any deployment, as it’s generally pretty good at flagging up issues that you may have overlooked.
Optimising Canvas App Performance
Best practice approaches can sometimes only take us part of the way towards building a well-running and optimised solution. Additionally, it can sometimes be unclear how we can go about this as developers of Power Platform solutions. For the specific purpose of canvas apps (and, indeed, for the exam itself), you should keep in mind the following throughout your development lifecycle:
- Instead of loading and surfacing data directly from your data source on each screen, consider instead implementing a collection and use commands such as Collect, Clear and ClearCollect to bring this data in when your application starts or when your screen loads for the first time via the OnVisible event handler. This will allow you to persist your data locally within the app itself, improving load times. Just make sure you run an appropriate Patch or Update to get your data updated back to the source, as the app will not do this for you by default.
- Depending on the data source you are working with, delegation may or may not apply as you query data from this source. There will be a specific set of formulas that will support delegation, certain functions that don’t support it and situations where it does not apply and, as such, issues may be encountered when working with records over a certain threshold (500 by default). The canvas app studio will indicate when a particular formula does not support delegation. As developers, we must evaluate the impact this has on our application, taking into account the record limit spoken about earlier.
For further details on how to identify and optimise your canvas apps, you can review Microsoft’s list of common sources for slow performance, common resolution steps and tips to improve performance.
As we can see, there is no good excuse not to devote time towards building quality applications, and Microsoft provides us with several tools in support of this objective. We must also continually evaluate our solutions as they are developed and deployed to ensure we are proactive with the individuals who use the solutions we build. In the next post in the series, we’ll be moving along to look at the Power Platform’s various business process automation tools.