
In today’s post, we will be taking a lot at some new functionality that I had the fortunate opportunity to play around with a short time ago. If you’re looking to enhance the way you store and manage log information relating to your Microsoft Dataverse plug-ins, then be sure to read on. 😀
So What’s the Deal?
In the past, developers of plug-ins have been limited to storing telemetry information directly within Microsoft Dataverse via the capabilities on offer as part of trace logging. While this offers us the ability to debug and detect potential problems arising from any custom code we’ve written, attempting to work with this information outside of Dataverse has typically been challenging, if not impossible. To help address this need, it is now possible for developers to output detailed logging and telemetry information into Application Insights as well. This offers several distinct benefits, including:
- The ability to easily extract and view this information via tools such as Power BI.
- Support for generating alert rules and custom actions, such as triggering a Logic App or Azure Function.
- No degradation in the quality of the outputted information; developers can expect to receive and work with the exact details currently available as part of trace logging.
Combined together, this capability affords new opportunities for organisations to more closely integrate their Power Platform solution with any existing monitoring capabilities that may already exist within their Microsoft Azure environment.
Now, it’s worth noting that all of this stuff is still currently in public preview, having been initially released in this manner in July last year as part of the Wave 1 2021 updates. Therefore, it’s recommended not to use this yet for any production scenarios; however, it represents an excellent opportunity for developers to review what’s on offer and take steps to consider using it in the future.
Getting Started
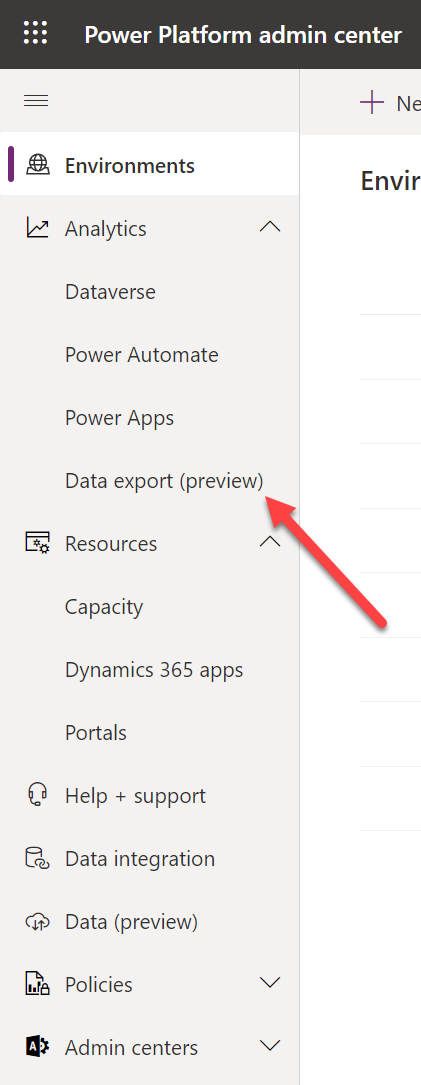
First, make sure you have an Application Insights resource stood up on Microsoft Azure, ideally within the same region as your Dataverse environment. From there, you will then need to navigate into the Power Platform Admin Center and navigate into the Data Export (preview) area:
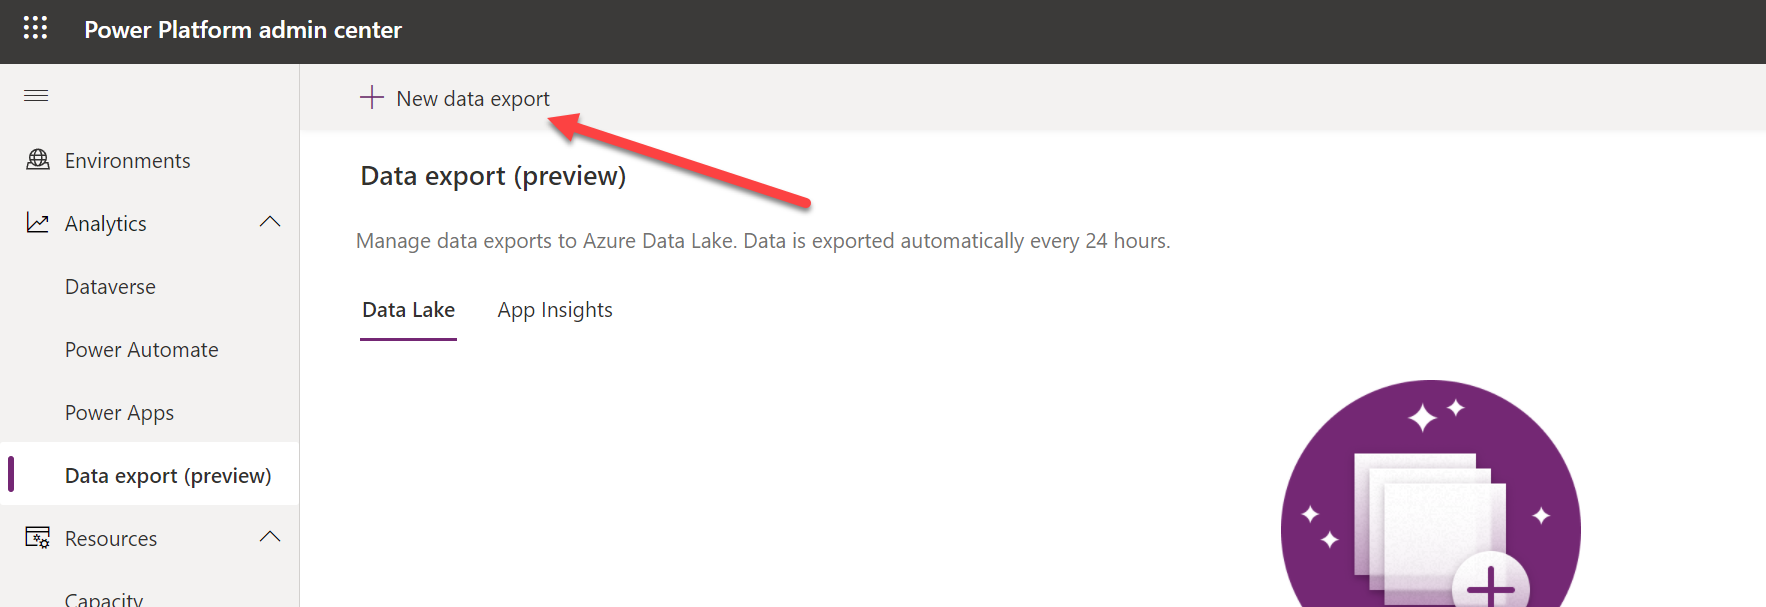
Then, select New Data export:
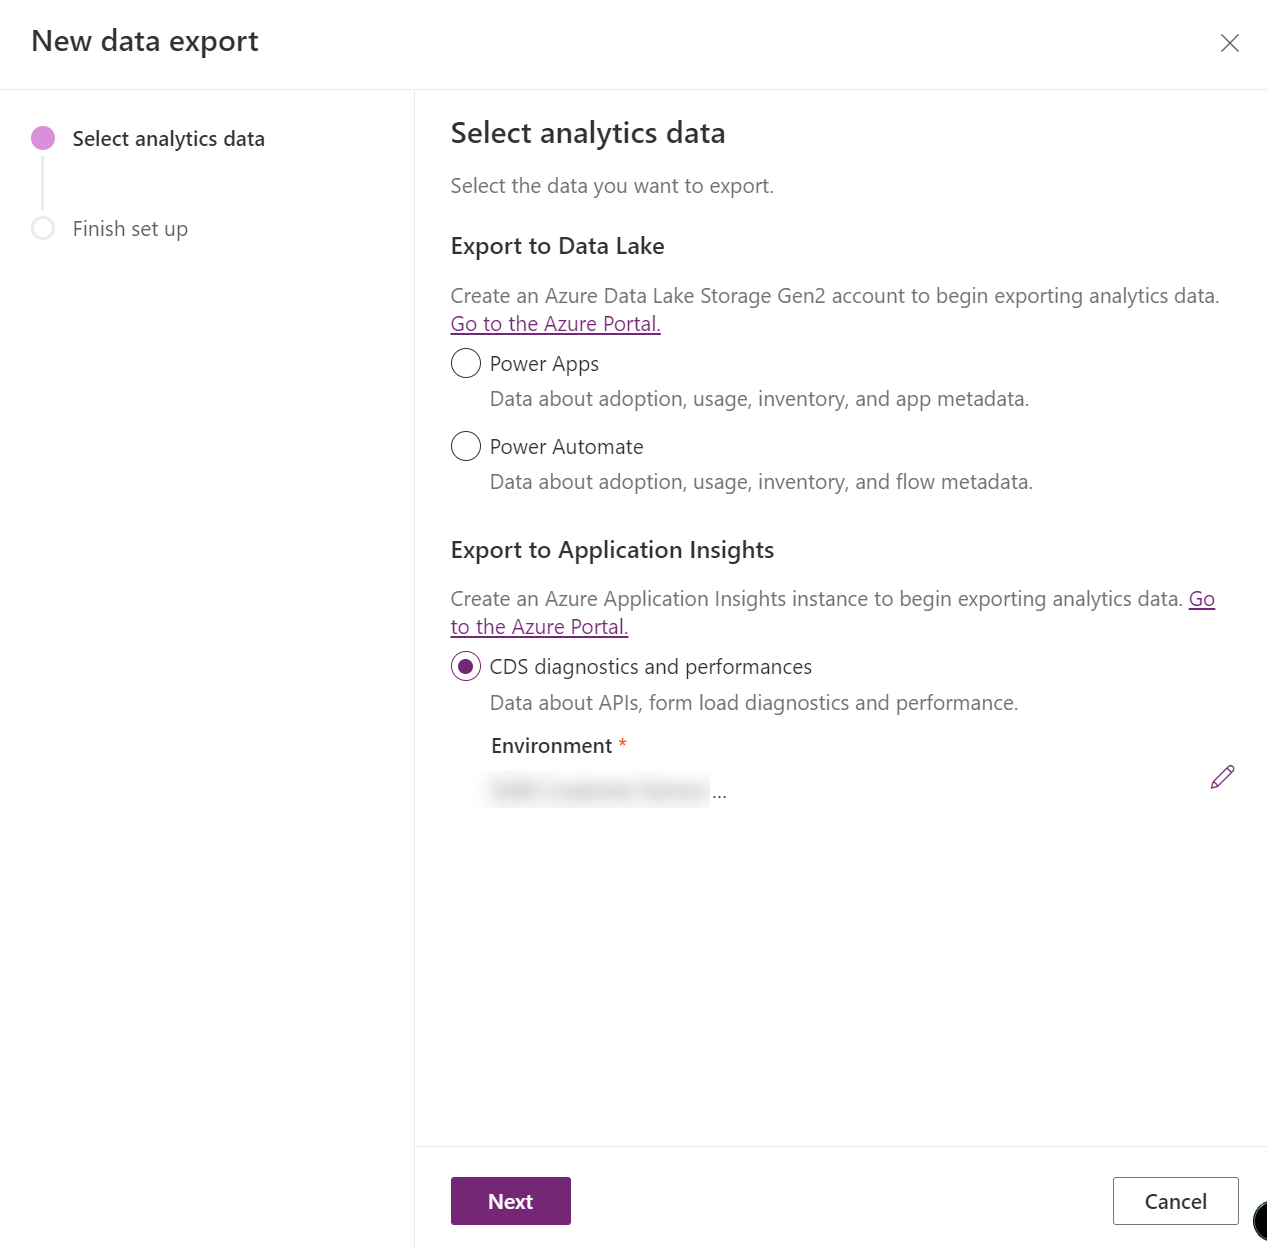
On the New data export pane, select the CDS diagnostics and performance option and choose the environment you want to configure the integration for:
Then, on the final screen, select the Application Insights resource you created earlier and select Create - provided you have the relevant access, all possible Azure subscriptions/resource groups/resources will appear in the appropriate dropdowns:
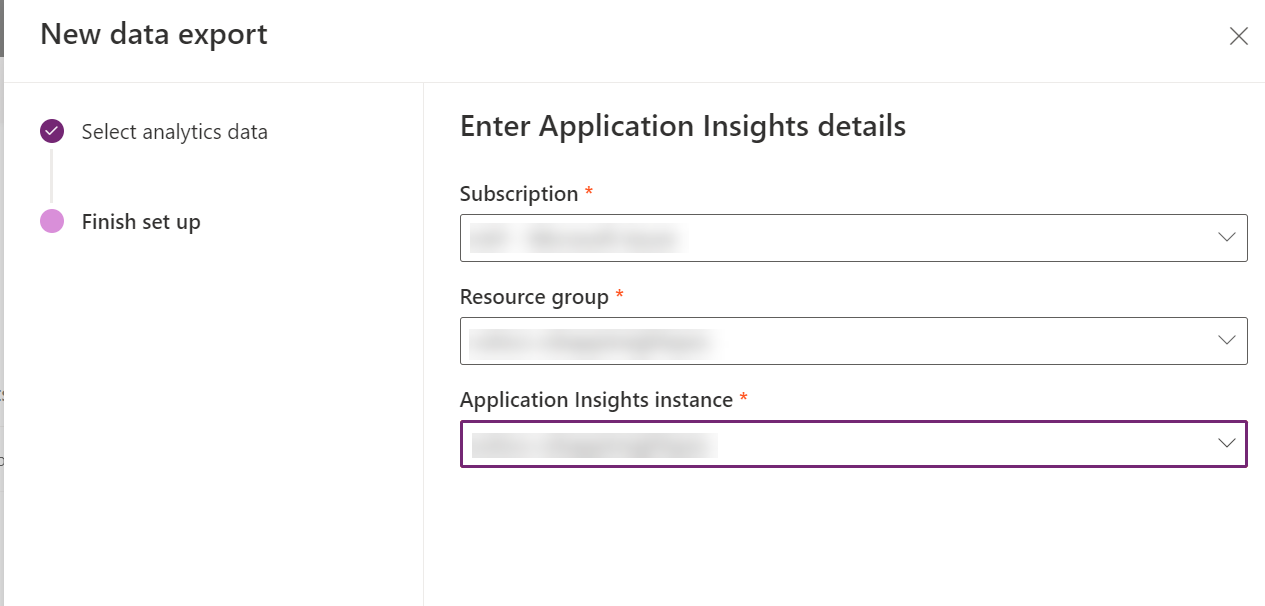
(It’s worth noting here that there is a strict 1:1 binding for Environment and Application Insights resource. Therefore, you may need to set up additional Application Insights resources to accommodate this restriction.)
And that’s everything setup successfully, which we can confirm by navigating to the App Insights tab:
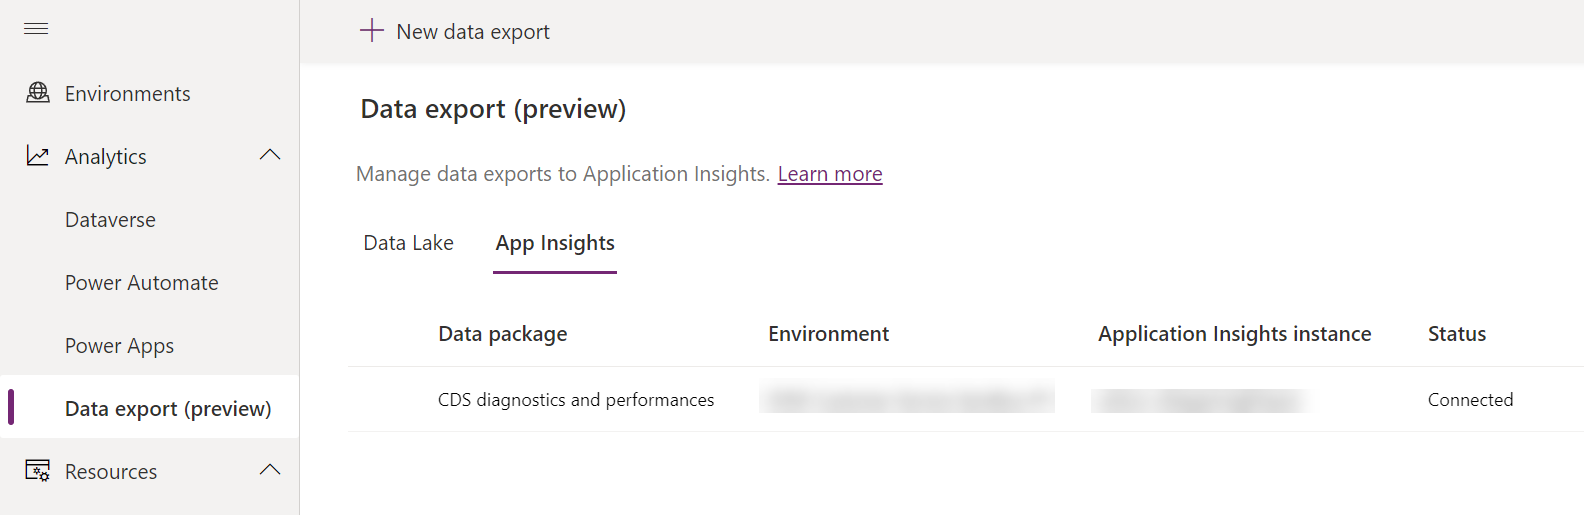
Pretty straightforward, I’m sure you’ll agree - provided you know where to find it, of course. 😉
Next, we need to implement a plug-in that uses the ILogger Interface. This is included as part of the System.Net.Http assembly, which should be added automatically as part of any new class assembly project; otherwise, add it in from NuGet. From there, we can start to think about using this in our code. Let’s assume our plug-in project is called JJG.Plugins.AppInsightsSample. First, create a folder in the project called Helper and then add in the following custom class:
using Microsoft.Xrm.Sdk;
using Microsoft.Xrm.Sdk.PluginTelemetry;
using System;

namespace JJG.Plugins.AppInsightsSample.Helper
{
   /// <summary>
   /// Class used to consolidate all Tracing / Logger calls into a single action.
   /// </summary>
   public class Logger
   {
      private readonly ITracingService tracer;
      private readonly ILogger logger;
      public Logger(IServiceProvider serviceProvider)
      {
         tracer = (ITracingService)serviceProvider.GetService(typeof(ITracingService));
         logger = (ILogger)serviceProvider.GetService(typeof(ILogger));
      }
      /// <summary>
      /// Logs information out to the Trace Log and Application Insights resource for the current environment.
      /// </summary>
      /// <param name="log">The actual message to log out.</param>
      public void LogInformation(string log)
      {
         logger.LogInformation(log);
         tracer.Trace(log);
      }
      /// <summary>
      /// Logs an error out to the Trace Log and Application Insights resource for the current environment.
      /// </summary>
      /// <param name="log">The actual message to log out.</param>
      /// <param name="log">Exception details to log out into Application Insights.</param>
      public void LogError(string log, Exception ex)
      {
         logger.LogError(ex, log);
         tracer.Trace(log);
      }
   }
}
The class acts as a means of simplifying any calls out to the Logger and the plug-in trace log, as and when we need to. I would advise always writing out to both destinations so that any relevant information from a debugging standpoint is also available within Dynamics 365.
Next, we’ll need to add in a plug-in that performs some action. In this case, we have a plug-in that goes off and creates a couple of Task rows on a Case, provided that the source of the Case does not equal Facebook:
using System;
using System.ServiceModel;
using Microsoft.Xrm.Sdk;
using JJG.Plugins.AppInsightsSample.Helper;
using System.Collections.Generic;

namespace JJG.Plugins.AppInsightsSample
{
   public class Case_OnUpdate_PushAppInsightsSample : IPlugin
   {
      private int facebookCaseOrigin = 2483;
      public void Execute(IServiceProvider serviceProvider)
      {
         //Obtain the execution context from the service provider.

         IPluginExecutionContext context = (IPluginExecutionContext)serviceProvider.GetService(typeof(IPluginExecutionContext));

         // Check for EntityType and Message supported by your Plug-In
         if (context.MessageName != "Update" && context.PrimaryEntityName != "incident")
            throw new InvalidPluginExecutionException($"Plug-In {this.GetType()} is not supported for message " +
                                                      $"{context.MessageName} of {context.PrimaryEntityName}");

         //Initialize Tracing / Logger for Application Insights - custom class used to simplify the calls
         Logger logger = new Logger(serviceProvider);
         logger.LogInformation("Tracing / Logging implemented successfully!");

         try
         {
            //For the sample, just create a couple of Tasks on the Case and output details to logging.
            //Also simulate an error scenario, based on the Case Origin value

            Entity incident = (Entity)context.InputParameters["Target"];
            Entity postIncident = context.PostEntityImages["PostImage"];
            logger.LogInformation($"Case ID: {incident.Id}");
            OptionSetValue incidentOrigin = postIncident.GetAttributeValue<OptionSetValue>("caseorigincode");
            logger.LogInformation($"Origin (Value): {incidentOrigin.Value}");

            if (incidentOrigin.Value == facebookCaseOrigin)
            {
               string error = $"Invalid Case Origin specified. Facebook Origin's are not allowed.";
               throw new InvalidPluginExecutionException(error);
            }
            else
            {
               logger.LogInformation($"Creating Tasks for Case ID {incident.Id}");

               //Get a reference to the Organization service.
               IOrganizationServiceFactory factory = (IOrganizationServiceFactory)serviceProvider.GetService(typeof(IOrganizationServiceFactory));
               IOrganizationService service = factory.CreateOrganizationService(context.UserId);

               List<int> taskNumbers = new List<int>()
               {
                  1,2,3,4
               };

               foreach(int number in taskNumbers)
               {
                  logger.LogInformation($"Processing Task # {number}...");
                  Entity task = new Entity("task");
                  task["subject"] = $"Case Task # {number}";
                  task["scheduledend"] = DateTime.UtcNow.AddDays(7);
                  task["regardingobjectid"] = new EntityReference("incident", incident.Id);
                  Guid taskID = service.Create(task);
                  logger.LogInformation($"Task ID {taskID} created successfully.");
               }

               logger.LogInformation($"Plugin {this.GetType()} execution successfully completed!");
            }
         }
         catch (InvalidPluginExecutionException pex)
         {
            logger.LogError(pex.Message, pex);
            throw;
         }
         catch (FaultException<OrganizationServiceFault> fex)
         {
            string message = fex.Detail.Message;
            string finalMessage = $"An error occurred in the {this.GetType().FullName}:{Environment.NewLine}{message}{Environment.NewLine}{fex}";
            logger.LogError(finalMessage, fex);
            throw new InvalidPluginExecutionException(finalMessage, fex);
         }
         catch (Exception ex)
         {
            string finalMessage = $"An error occurred in the {this.GetType().FullName}:{Environment.NewLine}{ex}";
            logger.LogError(finalMessage, ex);
            throw new InvalidPluginExecutionException(finalMessage, ex);
         }
      }
   }
}
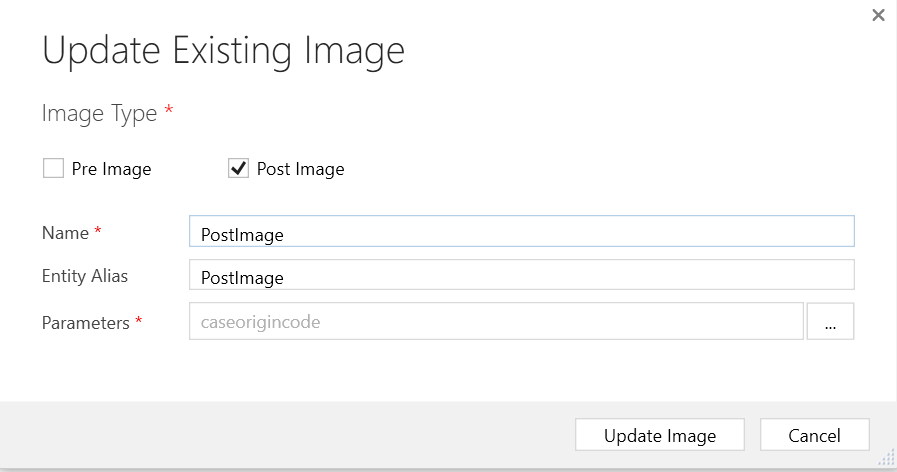
This plug-in requires a post-operation step that should be registered on Update of any column on the Case table (it doesn’t matter which one). The plug-in step will also require a Post Image configuring, as indicated below:
Reviewing the Logs
With logging enabled at the environment level, what we will find is that our Application Insights logs start filling up with execution details for every plug-in within the environment, alongside additional information relating to user requests, API calls and other related telemetry. We, therefore, need to write particular sets of queries to retrieve the information we want. The appropriate object types available to us include:
- dependencies: Stores details of all backend SDK operations executed in the environment, such as RetrieveMultiple, Update etc.
- exceptions: All custom / unhandled errors will be logged into here
- pageViews: Unrelated to our current purposes, we can use this object to see all actions carried out within a model-driven app by each user(s).
- requests: This object will log all Web API and Organisation Service Requests made against the environment.
- traces: Within here, every single message logged out using the LogInformation method will appear - one row for every single “trace”.
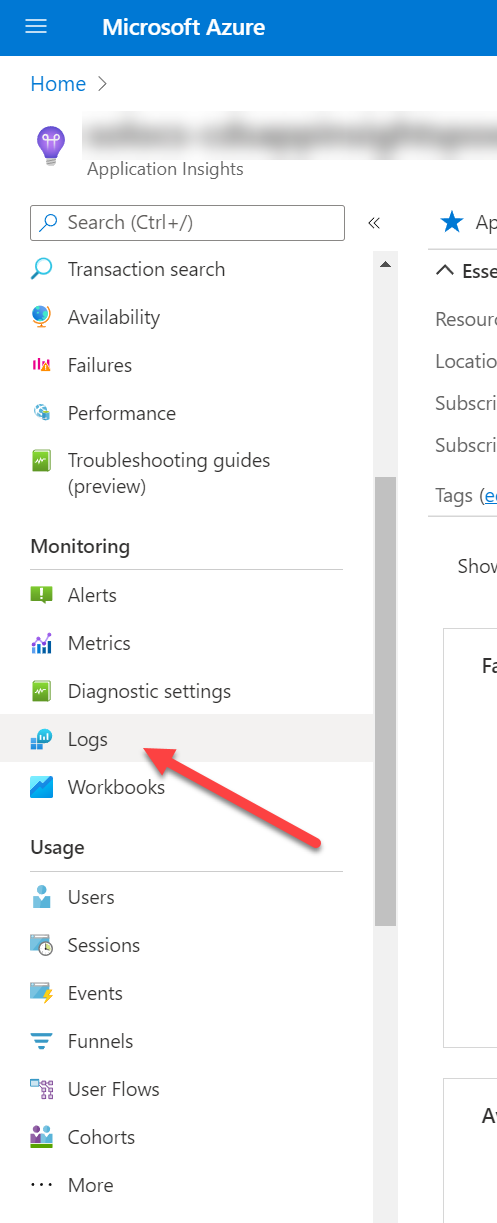
To help get you started, I’ve provided a couple of examples below, alongside an indication of the results we can expect to receive. To execute these, make sure we are in the Logs area of our Application Insights resource:
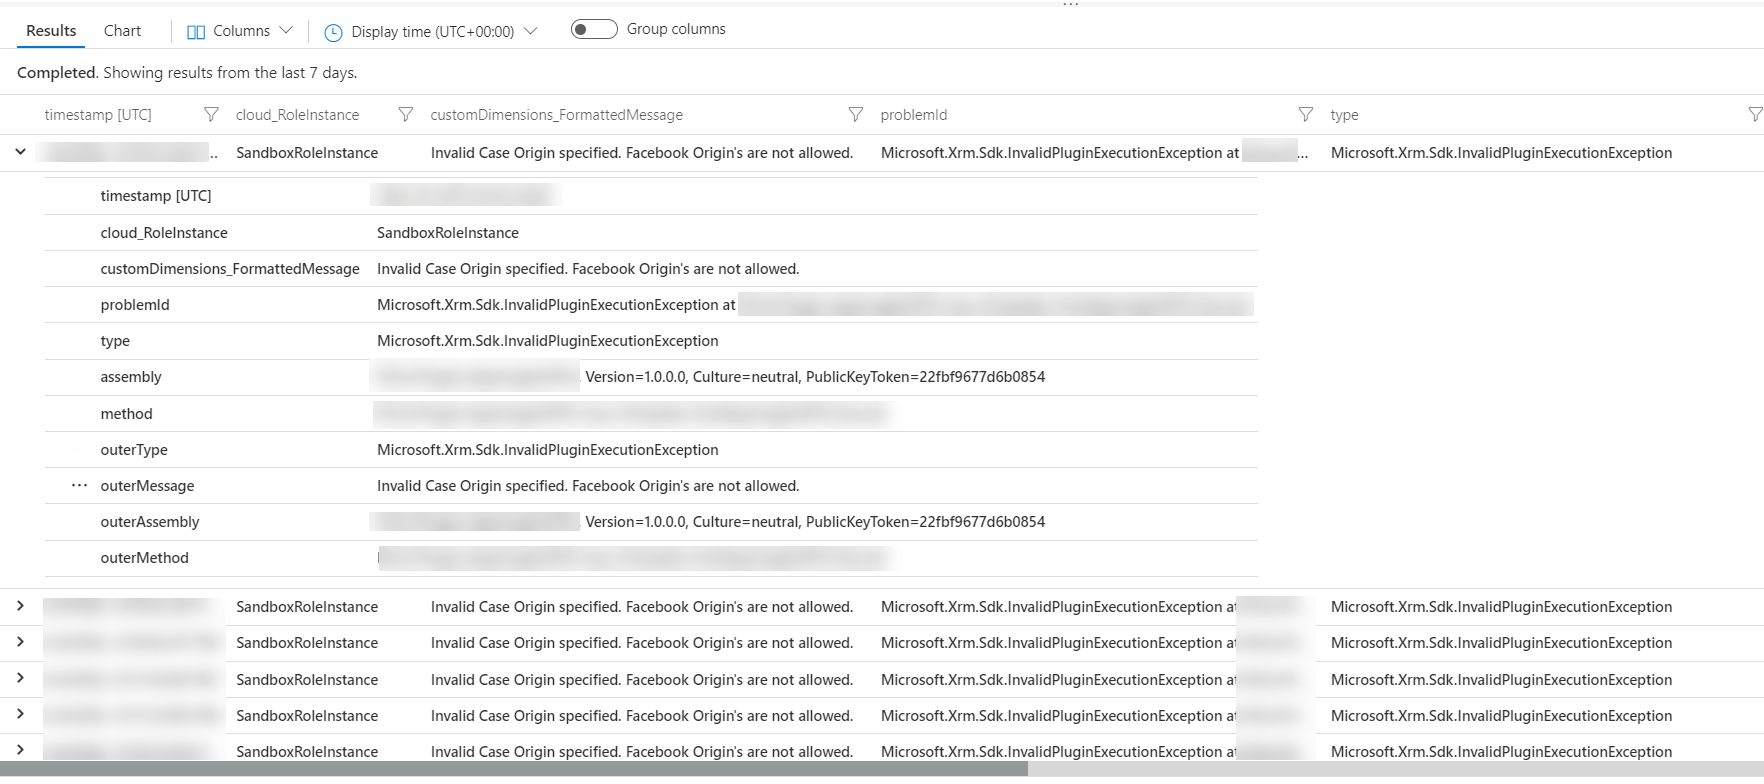
Return All Errors for Specific Plug-in
exceptions
| order by timestamp
| project timestamp, cloud_RoleInstance, customDimensions["FormattedMessage"], problemId, ['type'], assembly, method, outerType, outerMessage, outerAssembly, outerMethod
| where cloud_RoleInstance contains "SandboxRoleInstance" and method == "JJG.Plugins.AppInsightsSample.Case_OnUpdate_PushAppInsightsSample"
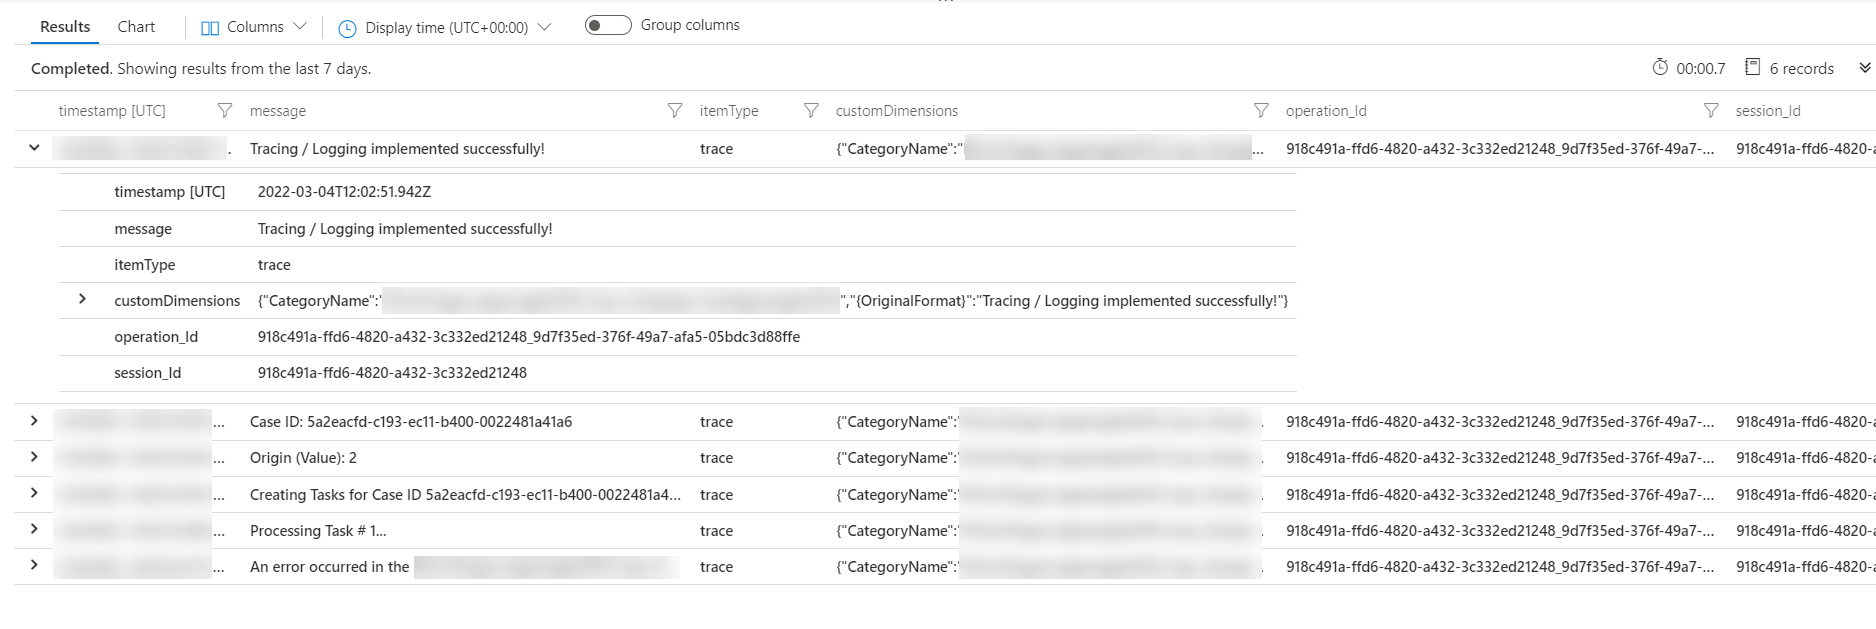
Get All Traces for Specific Plug-in Execution
traces
| project timestamp, message, itemType, customDimensions, operation_Id, session_Id
| where operation_Id == "918c491a-ffd6-4820-a432-3c332ed21248_9d7f35ed-376f-49a7-afa5-05bdc3d88ffe"
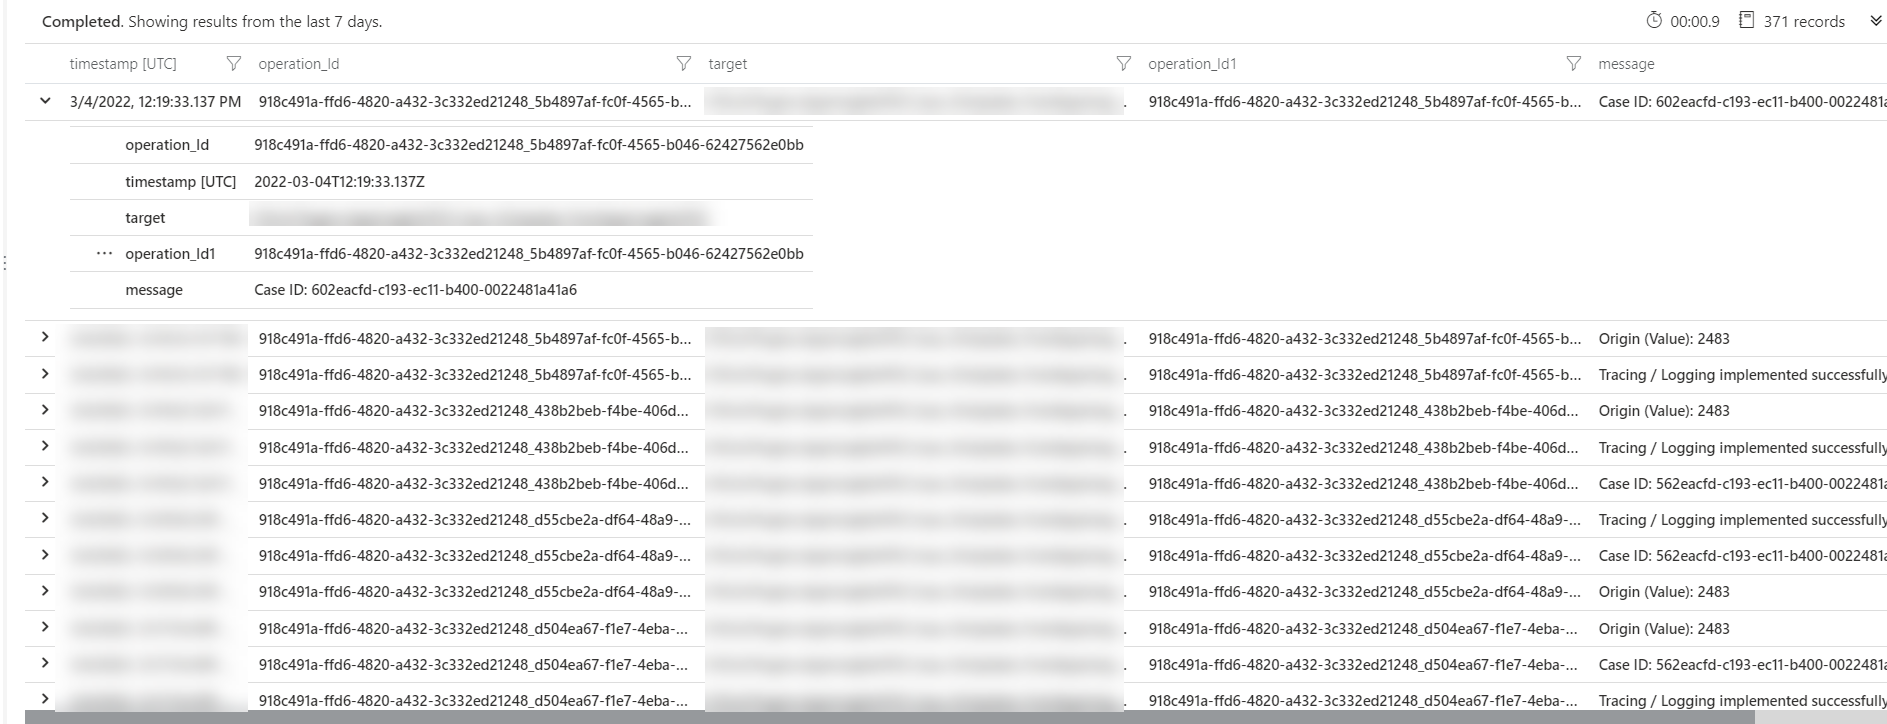
Get All Traces for All Failed Plug-in Executions
dependencies
| where type == "Plugin" and name == "JJG.Plugins.AppInsightsSample.Case_OnUpdate_PushAppInsightsSample" and success == false
| project operation_Id, timestamp, target
| join (traces
        | project operation_Id, message
    ) on $left.operation_Id == $right.operation_Id
| order by timestamp
Further Resources
Below are some links to the official Microsoft Docs on this subject - well worth a read, and I’m grateful to these posts in helping to put together this blog post:
- Write Telemetry to your Application Insights resource using ILogger (Preview)
- Preview: Analyze model-driven apps and Microsoft Dataverse telemetry with Application Insights
- Preview: Set up exporting to Application Insights
What do you think of this new functionality? Beneficial or too much hassle to work with? Let me know your thoughts in the comments below!