I’ve been doing some work with Power BI Online datasets this week. It’s the first time I’ve taken a look at them in any great detail, as I have traditionally preferred to create and deploy any data sources needed for my reports via the Desktop client. Datasets address the needs for users who do not necessarily have the necessary Power Query/DAX language and require a mechanism to quickly hook up to a pre-prepared dataset, thereby allowing them to start consuming any data rapidly. They are defined within an individual workspace and, once deployed, can then be shared out to other users to connect to. Datasets can help towards ensuring that any extensive piece of work developing a data model can be benefitted by as many users as possible and can reduce the need for people having to create data sources themselves if organised correctly. To find out more about how to create a dataset, you can take a look through my recent series all around Microsoft Exam 70-778, where I cover this topic in further detail.
Datasets can remove some headaches for more substantial Power BI deployments, but you should be aware of they can’t do. The most noteworthy limitations include:
- You can only connect a Power BI report to a single Power BI dataset at any time. You are unable to bring in additional data sources via Power Query and, likewise, if you have already defined several data sources within your report, you cannot then bring a Power BI dataset into your model.
- It is not possible to make any modifications to a Power BI dataset from within Power BI Desktop, either via Power Query manipulation or by adding DAX custom columns; you can, however, define new Measures using DAX.
Where this can start to be problematic is when you are attempting to surface data generated by the Applications Insights Continuous Export facility via a Stream Analytics job. The great thing about Stream Analytics is that you can define multiple input/output locations for data that it processes, one of which includes a Power BI dataset. A convenient feature and one that can potentially sidestep the need to export any information out to a SQL-based destination for further processing. However, one area where the feature handicaps itself is in the fact that you cannot output multiple tables within the same Power BI dataset. If you attempt to do this, you get the following error message:
When you take into account the limitations mentioned above concerning a strict 1:1 mapping between dataset/report, problems can arise when it comes to defining your queries on the Stream Analytics side of things. You either have to export out all of the base information in a raw format or instead develop highly customised queries on the Stream Analytics side. The latter solution may successfully meet a specific business requirement, but risks putting you in a position where your BI solution contains many different reports, some of which may only include a meagre amount of visualisations. I’m not sure about you, but my preference would be more towards the first option, as opposed to building out an overtly complex BI solution; but the limitations that Power BI datasets introduce for this particular scenario does present some challenge in sticking to this mantra.
For example, assume we have the following Stream Analytics query that outputs Request information from Application Insights into a Power BI dataset:
SELECT
    requestflat.ArrayValue.id AS RequestID,
    requestflat.ArrayValue.name AS RequestType,
    requestflat.ArrayValue.responseCode AS ResponseCode,
    requestflat.ArrayValue.success AS RequestSuccessful,
    requestflat.ArrayValue.url AS URL,
    requestflat.ArrayValue.urlData.base AS BaseURL,
    requestflat.ArrayValue.urlData.host AS URLHost,
    requestflat.ArrayValue.durationMetric.value AS Duration,
    r.internal.data.id AS ID,
    r.internal.data.documentVersion AS DocumentVersion,
    r.context.data.eventTime AS EventTime,
    r.context.data.isSynthetic AS IsSynthetic,
    r.context.data.syntheticSource AS SyntheticSource,
    r.context.data.samplingRate AS SamplingRate,
    r.context.device.type AS DeviceType,
    r.context.device.roleName AS SlotName,
    r.context.device.roleinstance AS RoleInstance,
    r.context.session.isFirst AS IsFirstSession,
    r.context.operation.id AS OperationID,
    r.context.operation.parentID AS OperationParentID,
    r.context.operation.name AS OperationName,
    GetRecordPropertyValue(GetArrayElement(r.[context].[custom].[dimensions], 0), 'Platform') AS Platform,
    GetRecordPropertyValue(GetArrayElement(r.[context].[custom].[dimensions], 1), 'Browser') AS Browser,
    GetRecordPropertyValue(GetArrayElement(r.[context].[custom].[dimensions], 3), 'UserAgent') AS UserAgent,
    GetRecordPropertyValue(GetArrayElement(r.[context].[custom].[dimensions], 4), 'Browser_Version') AS BrowserVersion,
    GetRecordPropertyValue(GetArrayElement(r.[context].[custom].[dimensions], 5), 'Referrer') AS ReferralURL,
    r.EventProcessedUtcTime AS RequestEventProcessedUtcTime,
    r.context.[user].anonId AS AnonymousID,
    r.context.location.continent AS ClientLocation,
    r.context.location.country AS ClientCountry
INTO [PowerBIRequestsOutput]
FROM [Requests] AS r
CROSS APPLY GetElements(r.[request]) AS requestflat
Having the data in this format provides us with the most flexibility when tailoring things on the Power BI side of things. But what if you wanted to perform some ranking on the data, based on a distinct category value - for example, ranking each of the Browser values in popularity order, based on each visitor to the website? While it is certainly possible to do this via a Stream Analytics query, you would end up having to group the data, thereby reducing the wider usage that the dataset could accommodate. Fortunately, thanks to the fact that we can create DAX Measures, it is possible to overcome this to generate a ranking per category and then display the most popular browser as part of a Card visualisation. We first need to create the following Measure within Power BI Desktop:
Browser Ranking = RANKX(
                        ALLSELECTED(PowerBIRequestsOutput[browser]),
                        CALCULATE(
                                DISTINCTCOUNT(
                                    PowerBIRequestsOutput[anonymousid]
                                    )
                                ),,,Dense
                            )
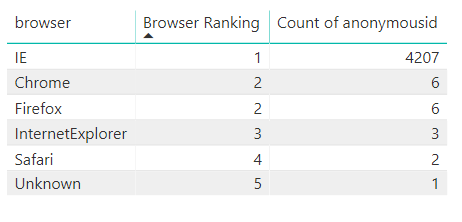
We can confirm this works as expected by dropping a quick table visualisation in and verifying that each Browser is being ranked correctly, based on the count of the anonymousid field:
So far, so good 🙂 And this is potentially a visualisation that has a good usage case solely on its own; but, with an additional DAX Measure, we can return the highest ranked value above, IE, via the following Measure:
Most Used Browser = TOPN(1, FILTER(VALUES(PowerBIRequestsOutput[browser]), [Browser Ranking] = 1))
Now, the thing to mention here is that the above does not explicitly handle ties in any sophisticated way; therefore, there is no guarantee over which value will display in the event of a draw for the top ranking. Nevertheless, it is encouraging to know that DAX provides us with the types of capabilities we need when we find ourselves unable to do the kind of manipulation we would want to, either via a SQL query or Power Query manipulation.


